
Monitoring a multi-cluster environment using Prometheus federation and Grafana
Monitoring the state of your clusters is an effective way to discover bottlenecks in your multi-cluster production environment. It is one of the key challenges that development teams are facing and factors such as the team experience as well as the number and distribution of the applications can make things even more complex.
Better monitoring can help identify single points of failure. Being able to get information about things like the number of applications running on each node or the CPU and memory performance can help to get closer to zero downtime deployments.
At Mattermost we run multiple Kubernetes clusters in AWS, deployed with our own Mattermost provisioning tool. The clusters are deployed across multiple AWS VPCs and this cluster distribution led to some challenges which are highlighted below:
- Choosing the correct tooling for monitoring
- Potential data transfer costs
- DNS resolution with dynamically created VPCs
The aim of this blog is to go through each one of the challenges we faced and outline the path we followed to reach the end solution.
Monitoring tooling
For the monitoring tooling, we selected a combination of the open source Prometheus and Grafana tools. Prometheus acts as the storage and query engine while Grafana acts as the interface for visualization of the monitoring data via dashboards and panels.
Grafana offers an easy to read interface that can be easily deployed and managed in a Kubernetes cluster. By supporting multiple datasources (Prometheus, MySQL, AWS CloudWatch, etc.), it can be used to monitor the whole infrastructure.
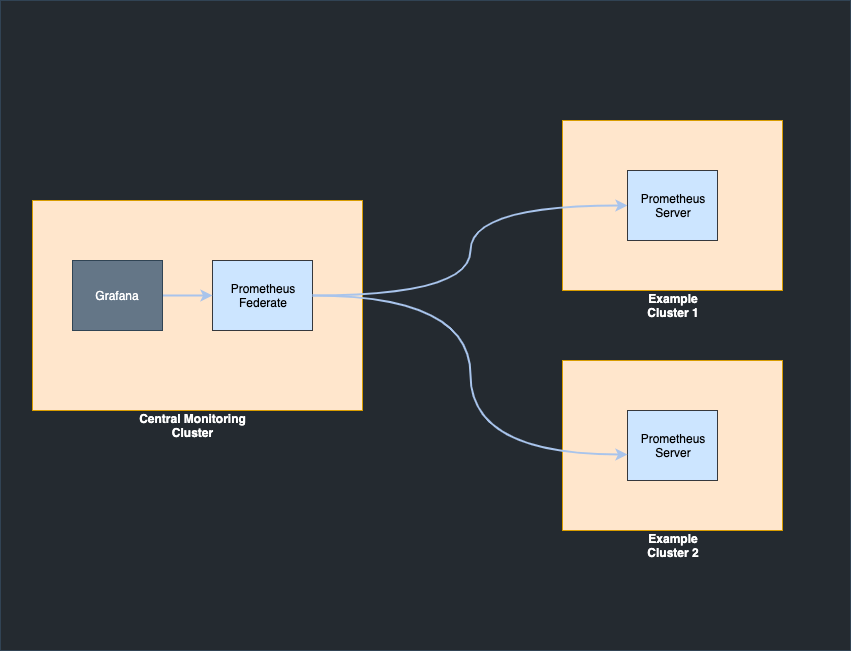
Prometheus collects metrics by scraping data from the clusters and we selected it for its simplicity and support, as well as its Prometheus Federation service, which can be used to scale to hundreds of clusters. Prometheus federation is a Prometheus server that can scrape data from other Prometheus servers. It supports hierarchical federation, which in our case resembles a tree.
At Mattermost, a default version of the Prometheus server is installed in each one of our clusters and a Prometheus federation server is deployed together with Grafana in a central monitoring cluster. Prometheus federation scrapes data from all the other Prometheus servers that run in our clusters. For future expansion, a central Prometheus federation can be used to scrape data from multiple Prometheus federation servers that scrape data from groups of tens of clusters.
Both of the tools are deployed in a central command and control cluster using Helm and Terraform. More information on the Terraform deployment code can be found here. For testing purposes the default version of Prometheus server can be installed by running:
helm install stable/prometheus
In order to install the Prometheus federation server, changes are required in the Helm values.yaml file and especially in the prometheus.yml section. The scrape_configs needs to be replaced by a federate job name. For more information, take a look at the code snippet below.
prometheus.yml:
    rule_files:
      - /etc/config/rules
      - /etc/config/alerts

    scrape_configs:
      - job_name: 'federate'
        scrape_interval: 15s

        honor_labels: true
        metrics_path: '/federate'

        params:
          'match[]':
            - '{job="prometheus"}'
            - '{__name__=~"job:.*"}'

        static_configs:
          - targets:
            - 'prometheus-server:80'
In this case we assume that the Prometheus federate config will be used only for data scraping from other Prometheus targets. However, another scrape config can be added in order to use the same Prometheus server for local cluster data scraping. We decided to not move forward with local data scraping as we would like to keep the Prometheus federation server dedicated to only one task and use another server for that.
The next step in the setup is to specify the Prometheus server targets that the Prometheus federate server will use to scrape the data. For the targets, each server is registered with Route 53 and the static config looks like this:
static_configs:
      - targets:
        - prometheus1.example.com.
        labels:
          clusterID: cluster1
      - targets:
        - prometheus2.example.com.
        labels:
          clusterID: cluster2
The use of labels makes the identification of the clusters easier in the Grafana dashboards and panels.
Having the ability to add and remove targets in an automated way is really important when a new Prometheus server is registered or deregistered with Route 53. This is why we developed a Lambda function that handles the updates of the Prometheus server configmap when a new Route 53 record is created/deleted.
Data transfer cost and DNS resolution
We were able to solve the final two challenges, minimizing data transfer costs and DNS resolution, together. A major factor of monitoring is that data transferring cost can be significant and in our case using AWS internal traffic reduced cost and improves security. Private Load Balancers, as well as private Hosted Zones and Transit Gateways are used to keep all traffic internal and support DNS resolution and cluster communication.
One of the obstacles we have faced by using private hosted zones had to do with the DNS resolution of Prometheus servers running in clusters in separate VPCs. Due to the traffic being internal, Bind9 servers are used for the resolution of the private hosted zone records. In addition, custom AMIs with preconfigured DNS setup are created and used for the cluster deployment.
With this setup, all services can communicate using custom internal DNS records and traffic cost was reduced to a couple of dollars per month.