Monitoring Cloud Environments at Scale with Prometheus and Thanos
In Mattermost, our monitoring solution is continuously evolving to meet our scaling infrastructure needs. Our previous architecture used Prometheus federation and was perfect for our small/medium infrastructure size, but was not able to scale in the way we needed.
This post will explain how we used Thanos and the Prometheus operator to scale our monitoring infrastructure and meet our long-term storage needs.
Overcoming Prometheus Scaling Difficulties
Prometheus is an open source systems monitoring and alerting toolkit that’s designed to record numeric time series events and make it easy to query data about the events. Prometheus is designed for reliability, and we used the federation service to scrape metrics in a multi-cluster environment.
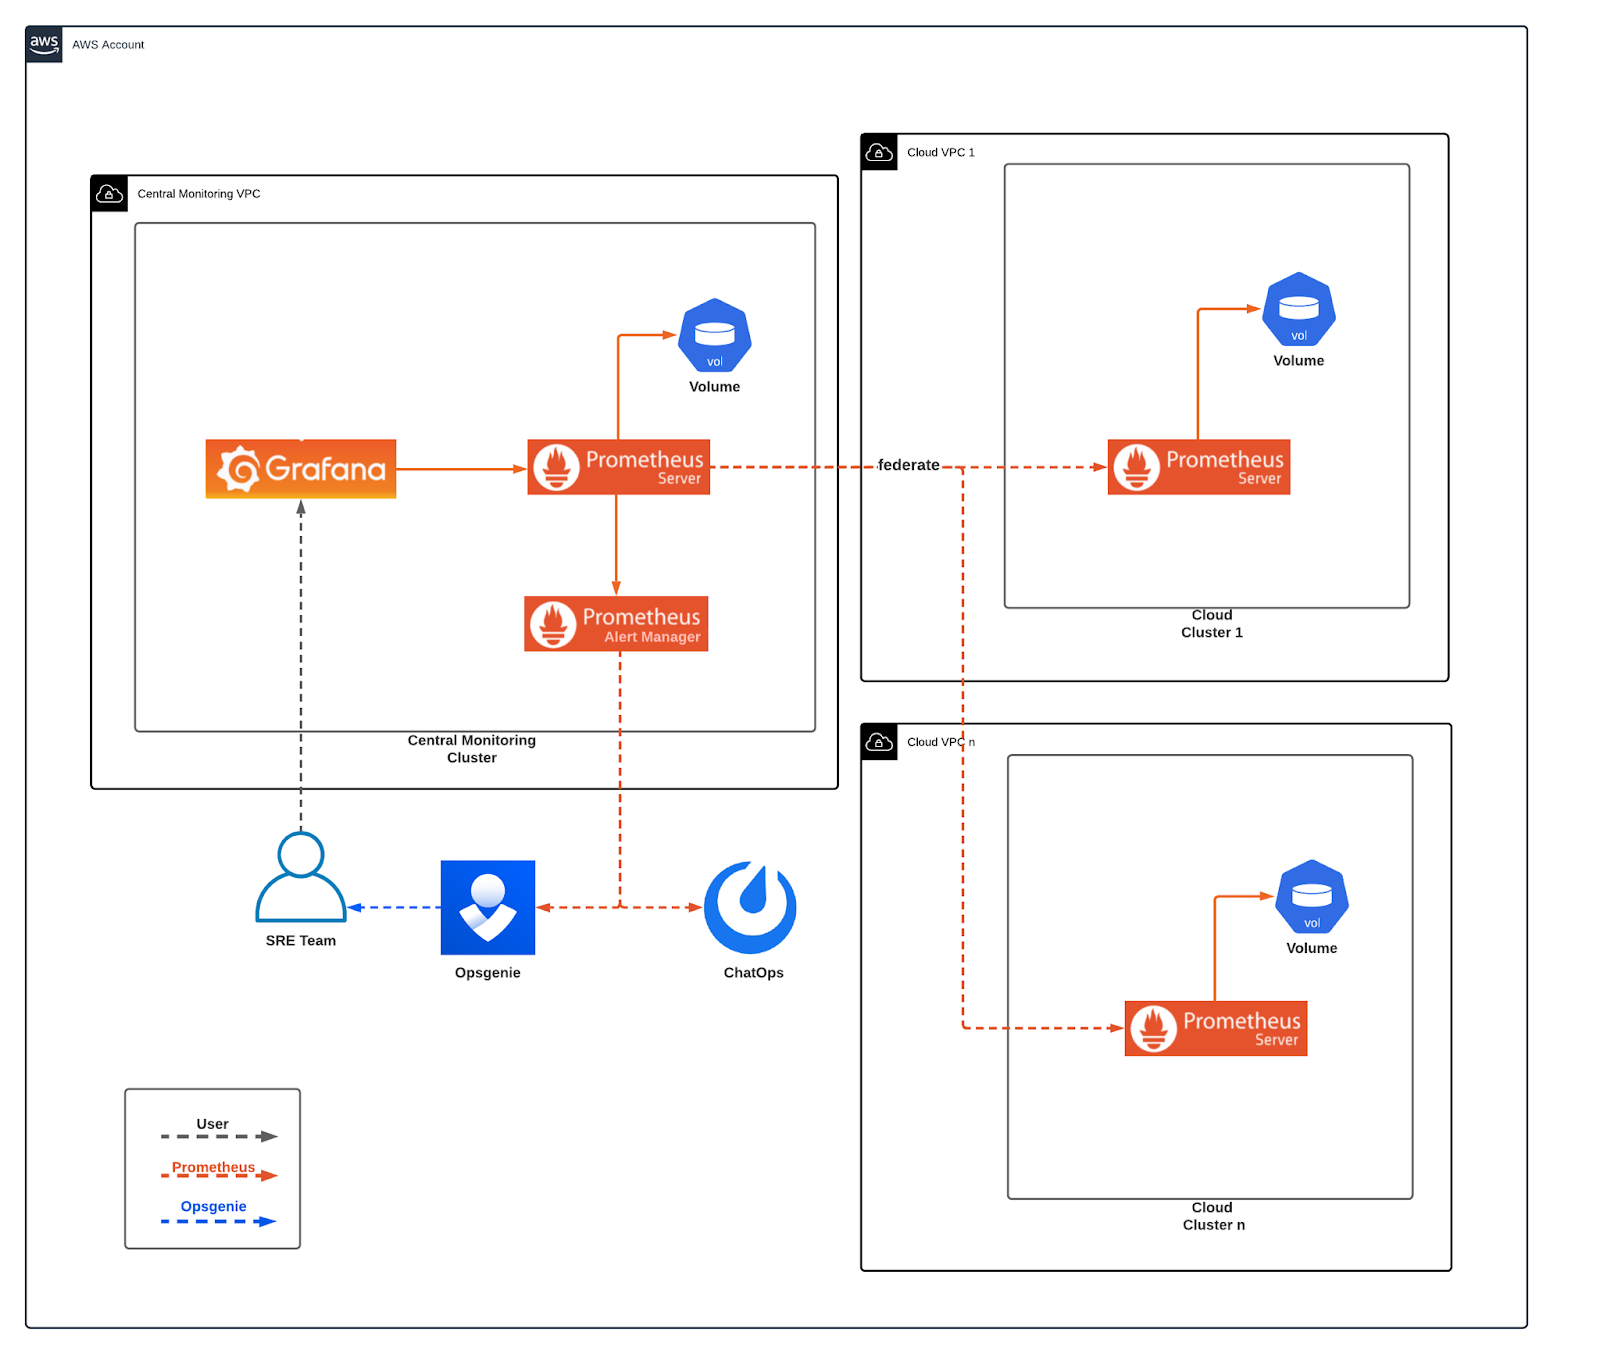
In this setup, a central Prometheus server scraped data from multiple client Prometheus servers using Prometheus Federation. It was possible to scrape metrics and handle alerts in real-time, but everything was stored in local volumes. This approach had several drawbacks:
- Data retention policy needed to be low to avoid huge costly volumes
- Each Prometheus server needed a big dedicated volume to operate, which increased costs
- We were not able to retrieve metric data for a long period of time
- Recovering data in volume failures was hard
- Alert anomaly detection was not possible with a low data retention policy
- An increase in client Prometheus metrics meant that the central Prometheus had to scrape more and more data, which led to to timeouts
How Thanos Makes Prometheus Better
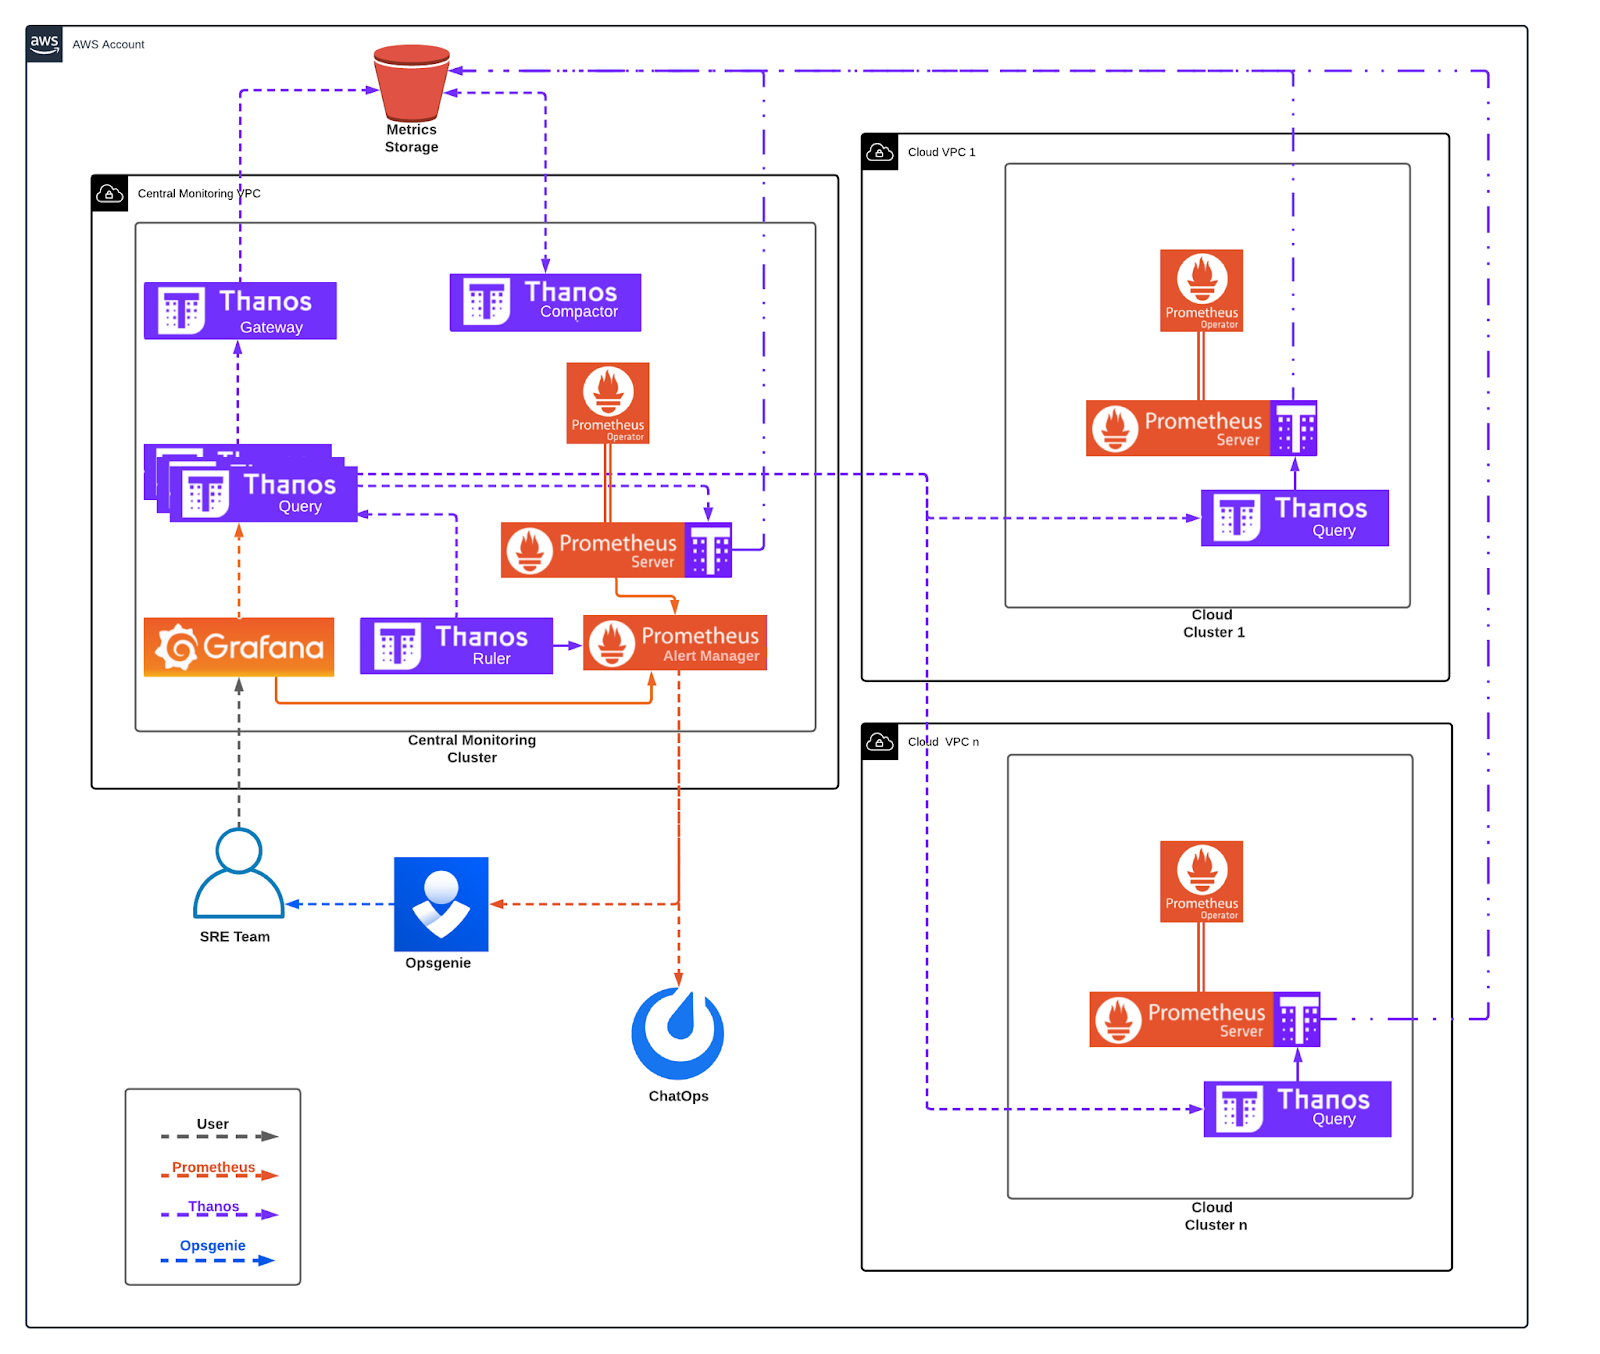
For our new monitoring setup, we selected our tooling with long-term needs in mind. Grafana and all the dashboards that were developed in the first setup are still being used, but Grafana now gets data from a Thanos query component. Prometheus’ deployment has been replaced by the Prometheus operator running in all our clusters and Thanos is the newly introduced component.
Thanos brings high availability and long-term storage capabilities to Prometheus. In addition, Thanos allows us to aggregate data from multiple Prometheus targets and query them from a single query endpoint. It can also automatically deal with metric duplication that may arise from multiple Prometheus deployments.
We’re leveraging 5 major components of Thanos:
- Thanos Sidecar: Thanos sidecar is a component that gets deployed along with a Prometheus instance and uploads metrics to object storage every two hours. That means that if Prometheus crashes you may lose data for up to two hours.
- Thanos Query: Thanos query uses registered store APIs to query for metrics using PromQL. It gives the ability to aggregate and deduplicate multiple metric backends under a single Thanos query endpoint.
- Thanos Gateway: Thanos gateway implements a store API on top of historical data sitting in object storage. It acts as an API gateway between the Thanos cluster and the object storage.
- Thanos Compactor: Thanos compactor creates data blocks following Prometheus compaction method in the object storage and can handle data downsampling by creating 5m and 1h blocks.
- Thanos Ruler: Thanos ruler connects to Thanos query component and evaluates Prometheus alerting and recording rules. It can use Prometheus alert manager to trigger alerts.
How Thanos Fits Into Prometheus Architecture
In our architecture, we use Thanos together with Prometheus and Grafana for metrics and alerting. In this new monitoring architecture, we kept the same approach of using a central cluster to get metrics, visualize, and create alerts for all our clusters. But by adding Thanos, we changed the way we handle long-term data.
How Thanos Query Makes it Easy to Monitor Cloud Clusters
Previously, all of our Mattermost cloud clusters were running a Prometheus deployment that was scraped from another central Prometheus server. In this new setup, Prometheus deployment is replaced by the Prometheus operator, which gave us more flexibility in managing the Prometheus stack. The operator has support for Thanos natively, so each Prometheus operator deployment also deploys the Thanos sidecar. The Thanos sidecar sends all Prometheus metrics in two-hour windows in a central precreated S3 bucket.
The new component added here is the Thanos query. It is the only component we need from the Thanos suite. It internally exposes a GRPC protocol k8s service, which is registered as a store API in the central Thanos query deployment. This is mainly used for live Prometheus metrics and short time queries, which can then be combined with the object store API to offer longer period metric queries.
How We Monitor Prometheus From a Central Cluster
As a central monitoring cluster, we define the cluster that we centrally obtain all the metrics, and we can use to visualize, create alerts, etc. In this cluster, the Prometheus operator is deployed similarly to the way it is deployed in the client clusters, because the central cluster needs to be monitored too. The Prometheus alert manager is also deployed, and sends alerts to Mattermost channels and the Opsgenie app.
In this cluster, all the Thanos components described in tooling are deployed:
Register Endpoints With Thanos Query
We use Thanos query to register all our client cluster store APIs plus the object store API. Considering that we have multiple client clusters, we needed an automated way to register new store endpoints in the central Thanos query component. We developed a microservice that checks for new endpoints and registers them with Thanos query.
Trigger Alerts With Thanos Ruler
We scrape metrics for all the applications we are using, such as Mattermost, Nginx, Fluentbit, etc. and have monitoring rules in place evaluated by the Thanos ruler. When a rule validation fails, Thanos ruler triggers an alert in Prometheus alert manager. The only component Thanos ruler cannot evaluate is itself. In that case, we use Prometheus to monitor the Thanos ruler.
Feed Data to Visualizations With Thanos
We use S3 bucket for object storage. The two Thanos components that are deployed handle the S3 bucket store API, as well as the data block creation and downsampling.
Grafana uses the central Thanos query endpoint to get metrics from all store APIs (object store, client clusters stores, central cluster store). This way we didn’t need to make any change in our Grafana dashboards and just replacing the Prometheus federate endpoint with the central Thanos query endpoint was enough.
Having the ability to use Grafana to visualize our cloud provider metrics, database data, etc. meant that we could use Grafana to create some alerting too. We now have basic Grafana created rules, triggering alerts to the central Prometheus alert manager.
Ready to Deploy Prometheus and Thanos Yourself?
To deploy all our components in all clusters, we use Helm charts for Prometheus operator, Thanos, and Grafana. Check out the Prometheus docs to learn more about how it can help you monitor cloud environments.