Reliability through monitoring: Improving real-time data observability in Mattermost
Mission-critical organizations require the highest levels of reliability from their applications, as the availability and performance of the applications directly affect their ability to achieve goals without interruption or failure.
One of the most important ways to ensure the reliability of any application is through monitoring. When monitored correctly, early signs of potential problems surface, teams are moved to action, and often bigger issues are stopped in their tracks.
When we think of monitoring at Mattermost, we are not talking about logging (which is itself needed for many reasons) but rather the real-time data coming out of the application. It is this real-time data that we use to make Mattermost so reliable.
It all started with the server
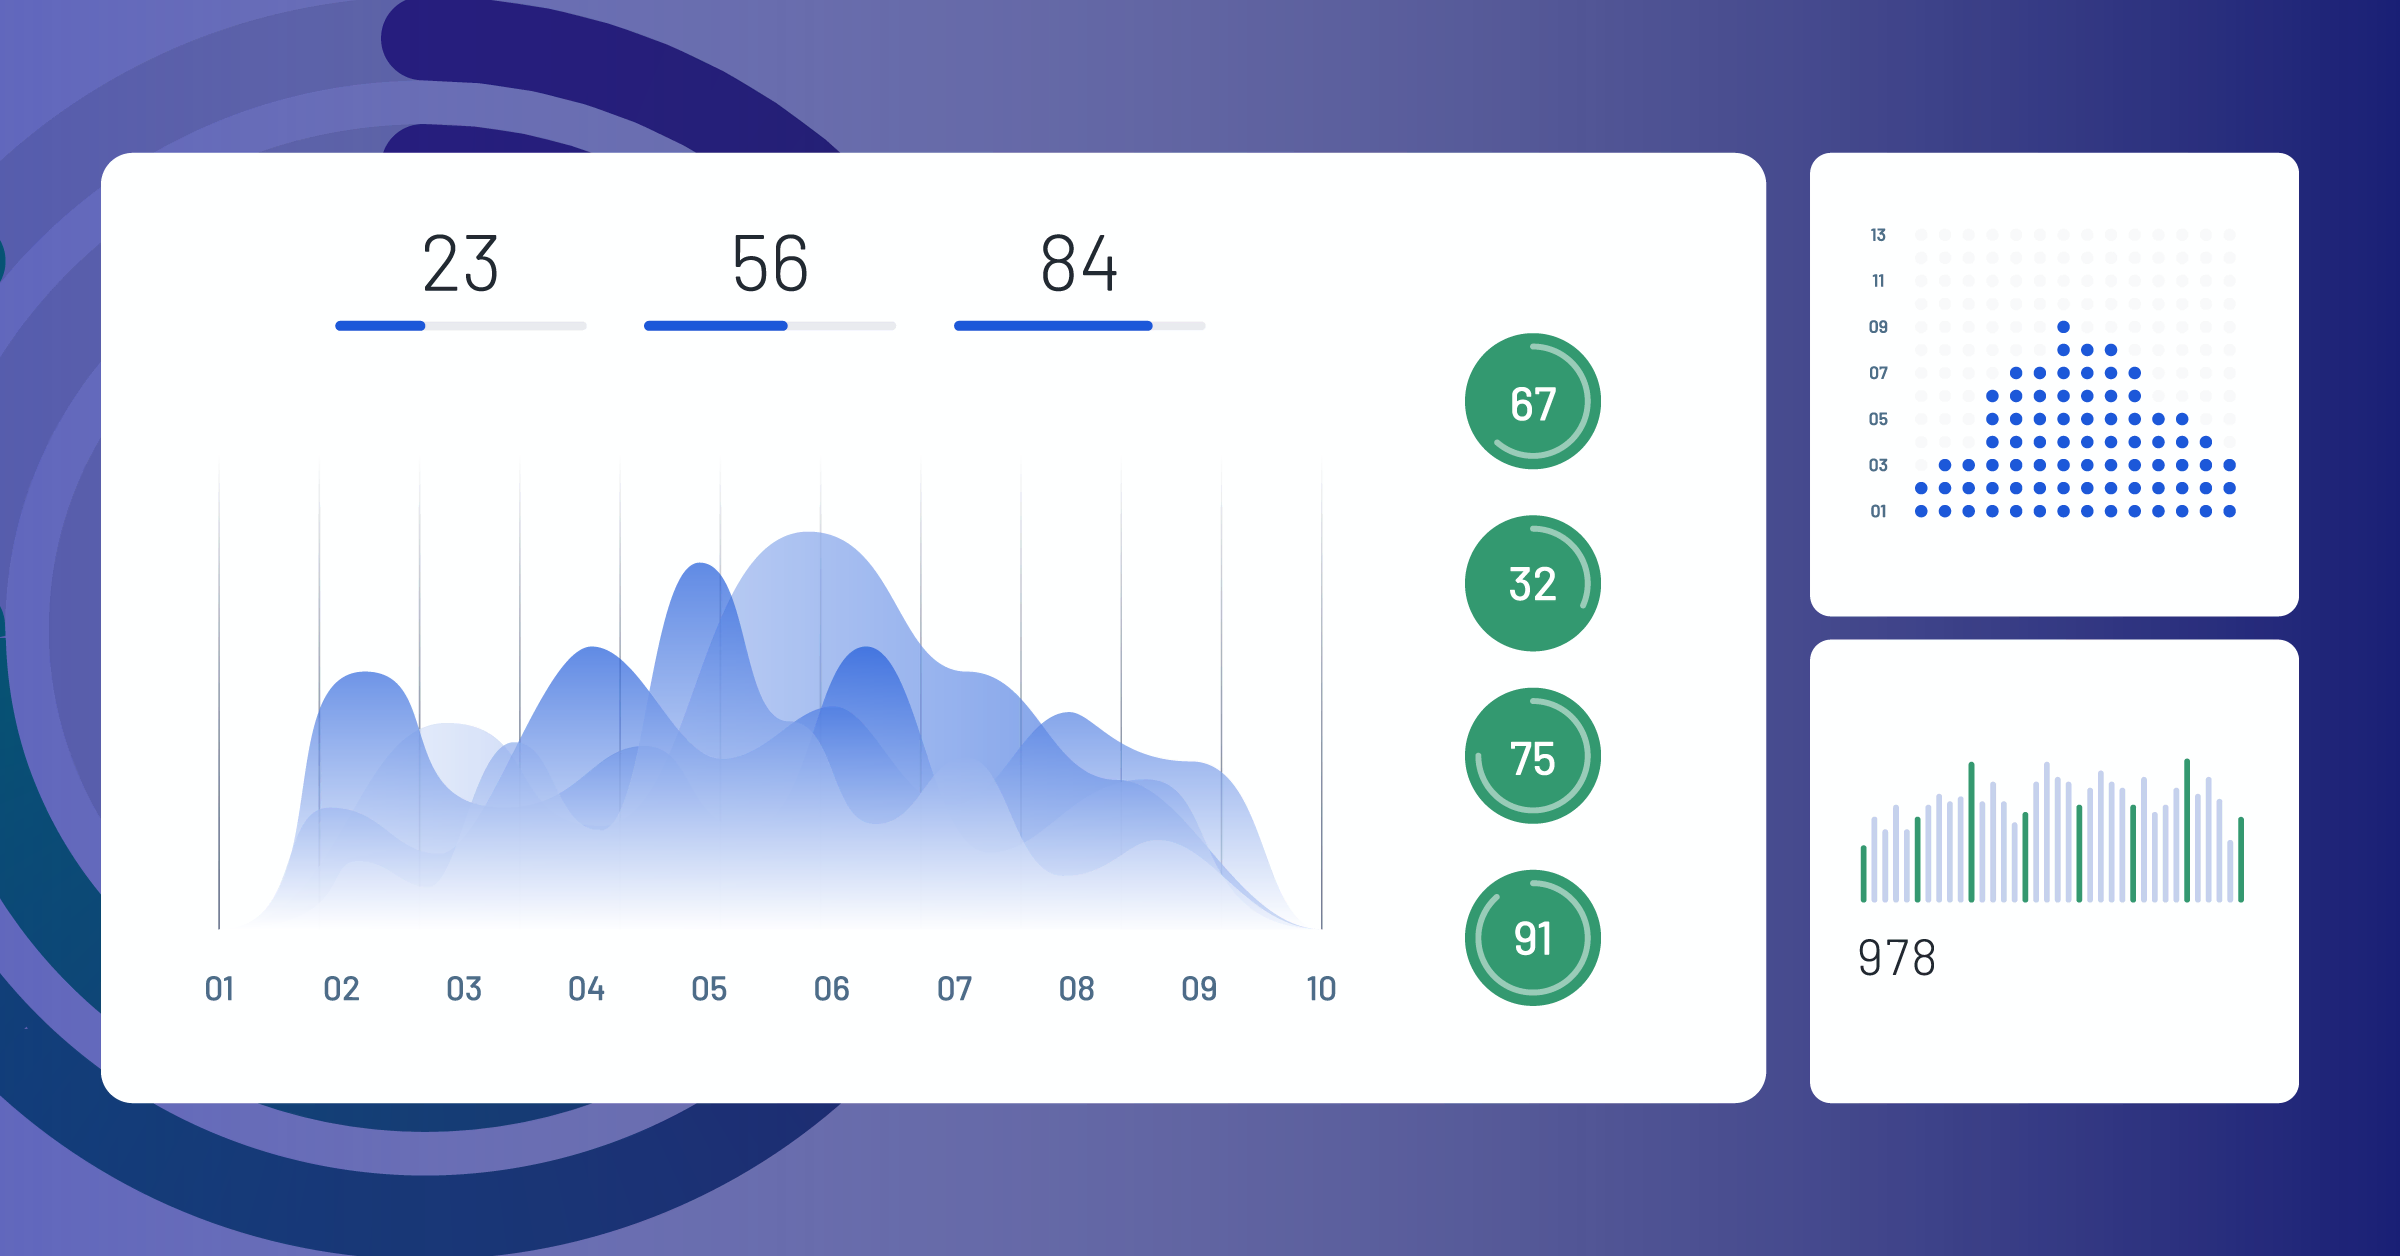
The Mattermost server has had the metrics endpoint for many years. Our Enterprise customers rely on this to build out their application dashboards in Grafana, giving them real-time insights into the server’s performance. Our Mattermost Performance Monitoring v2 dashboards contain details on the application, the cluster, the systems on which Mattermost runs, and the jobs running.
Monitoring is so key to a reliable application that we even built a metrics plugin for customers unable to deploy third-party applications like Prometheus and Grafana.
The point is, we take monitoring seriously at Mattermost.
End-to-end observability
Mission-critical collaboration means any performance issues seen by users have a real and measurable impact. The natural evolution of monitoring in Mattermost was to move beyond the server and start to include client data.
We needed to consider a few factors when determining how best to provide a 360-degree view of the application’s health.
As a self-hosted application, we deal with private networks, air-gapped deployments, and highly regulated industries. This means all traffic must be between the server and client. This is not as easy as it sounds, as adding data to the server/client communication introduces traffic.
Notifications are mission-critical
Building on the existing approach, we published the first revision of the Mattermost Notification Health Grafana dashboards in June. This dashboard provides a way to track both desktop notifications and mobile push notifications. You can now monitor the overall health of notifications and detect any changes in notification delivery as you upgrade server and client, make changes to the network, and how users access Mattermost (SSO) and other administrative tasks.
To enable this in Mattermost v9.x or above you need to use the feature flag NotificationMonitoring and set to true
Monitor client performance
Mattermost is a client-server application, specifically a three-tier architecture. This means that when using the web browser, desktop, or mobile app we have to consider both the client<>server performance, and also the client’s performance itself.
We extended the metrics collected from the clients and created new dashboards. We published the Web App Metrics dashboard, which captures user actions such as channel switching time, Thread loading time, how quickly the right-hand side panel opens and more. We also published a Mobile Performance Metrics, capturing similar data, whilst also giving a lifetime breakdown of iOS vs Android.
Remember, if you don’t have Prometheus and Grafana this will still be available when using the metrics plugin.
What are our future reliability monitoring plans?
We have more plans for monitoring, including extending the dashboards for mobile and desktop, building in thresholds (to help you identify potential issues early), and also providing visibility into the clients being used.
The best way to have Mattermost performant and reliable is to ensure you are always running a supported release. This includes clients. We recently released our first-ever ESR (Extended Support Release) desktop client. Not only can you now run a supported server and client for longer, but we plan to publish dashboards that give insights into client versions in use, all designed to improve the end-to-end reliability you need from your Mission-Critical collaboration application.
If you’re interested in learning more about monitoring the reliability of your Mattermost environment, we’d love to help. Submit a support ticket to book a health check with your Mattermost support team today.


