Manage Dynamic Schemas at Scale with Rudderstack & dbt
I recently had the pleasure of hosting a webinar with the team over at Rudderstack. It focused on Data Engineering and managing dynamic schemas at scale. More specifically, Rudderstack-generated, dynamic schemas at scale. This blog will discuss the tools, software, and methods to do just that.
Tools & Software: The Analytics Engineer’s Batman Utility Belt
Rudderstack provides software to simplify customer data collection across apps, web properties, and various other SaaS platforms. The software generates a set of uniform schemas and relations in your data warehouse, allowing you to track engagement across multiple platforms. It also provides functionality to capture custom events stored as new relations in your existing platform-specific schemas while doing all this at a fraction of the cost of its competitors.
That said, the webinar focused on data management, and Mattermost as a platform generates a TON of data. Our Engineering team is constantly designing new features, iterating on existing features, and instrumenting novel methods for capturing engagement across our product and web properties.
As an Analytics Engineer at Mattermost, I can tell you firsthand that cleaning and transforming data for quality, usability, and analysis often feels like a herculean task; as soon as you finish grappling with the latest data source, two more appear in its stead.
At least, that was the case when I first began at Mattermost. Our analytics infrastructure was disjointed and lacked scalability. Our raw data was being transformed directly in our BI tool, Chart.io, via one-off SQL queries. I was endlessly cleaning, loading, transforming, and querying data one visualization at a time — a modern-day Sisyphus pushing a metaphorical boulder (in this case, a production-ready Analytics environment) up a hill.
It was maddening. And then, my colleague and fellow data engineer identified a simple, cost-effective solution for managing data pipelines. Drumroll, please…
Dbt: A Data Engineer’s Best Friend
Dbt. A tool brought to you by the company formerly known as Fishtown Analytics. From a data engineering perspective, dbt or “data build tool” is invaluable. It handles database DDL and maps model dependencies seamlessly. Not to mention it supports a more scalable data modeling framework for visualizing data, which simplified our migration to a more robust BI tool, Looker. And in terms of its utility, that’s just the tip of the iceberg.
Dbt also supplies tools to rebuild relations and schemas, incrementally load data, and simplify the most tedious of data engineering tasks. However, dbt’s greatest feature by far, its crown jewel, is its macros. Dbt macros provide the flexibility to create custom functions for your specific data engineering needs, as well as choose from a library of open-source, out-of-the-box functions. All of this is accomplished by blending Jinja2, a templated Python-like language, with SQL to supercharge data modeling in ways that only the most sophisticated developers and data engineers had achieved in the past.
How To Manage Dynamic Schemas at Scale With Dbt Macros
As I touched on earlier, the topic of the webinar was managing dynamic schemas at scale. The key words being “at scale.” And the question I kept asking myself was, “How can I accomplish scaling our analytics infrastructure with my sanity intact?”
I’ll tell you how: Dbt macros.
Constantly updating master scripts with the latest data sources and properties wasn’t sustainable, so I took it upon myself to build a custom dbt macro. The objective: to clean, transform, and union entire sets of schemas and their relations in a single “Master User Analytics” table using only a couple lines of code. It needed to be able to do several things:
- Receive multiple arguments to define target databases, schemas, and relations
- Identify column requirements and account for missing columns
- Automatically detect and include new data sources in the target schemas
- Provide logic to load new data incrementally
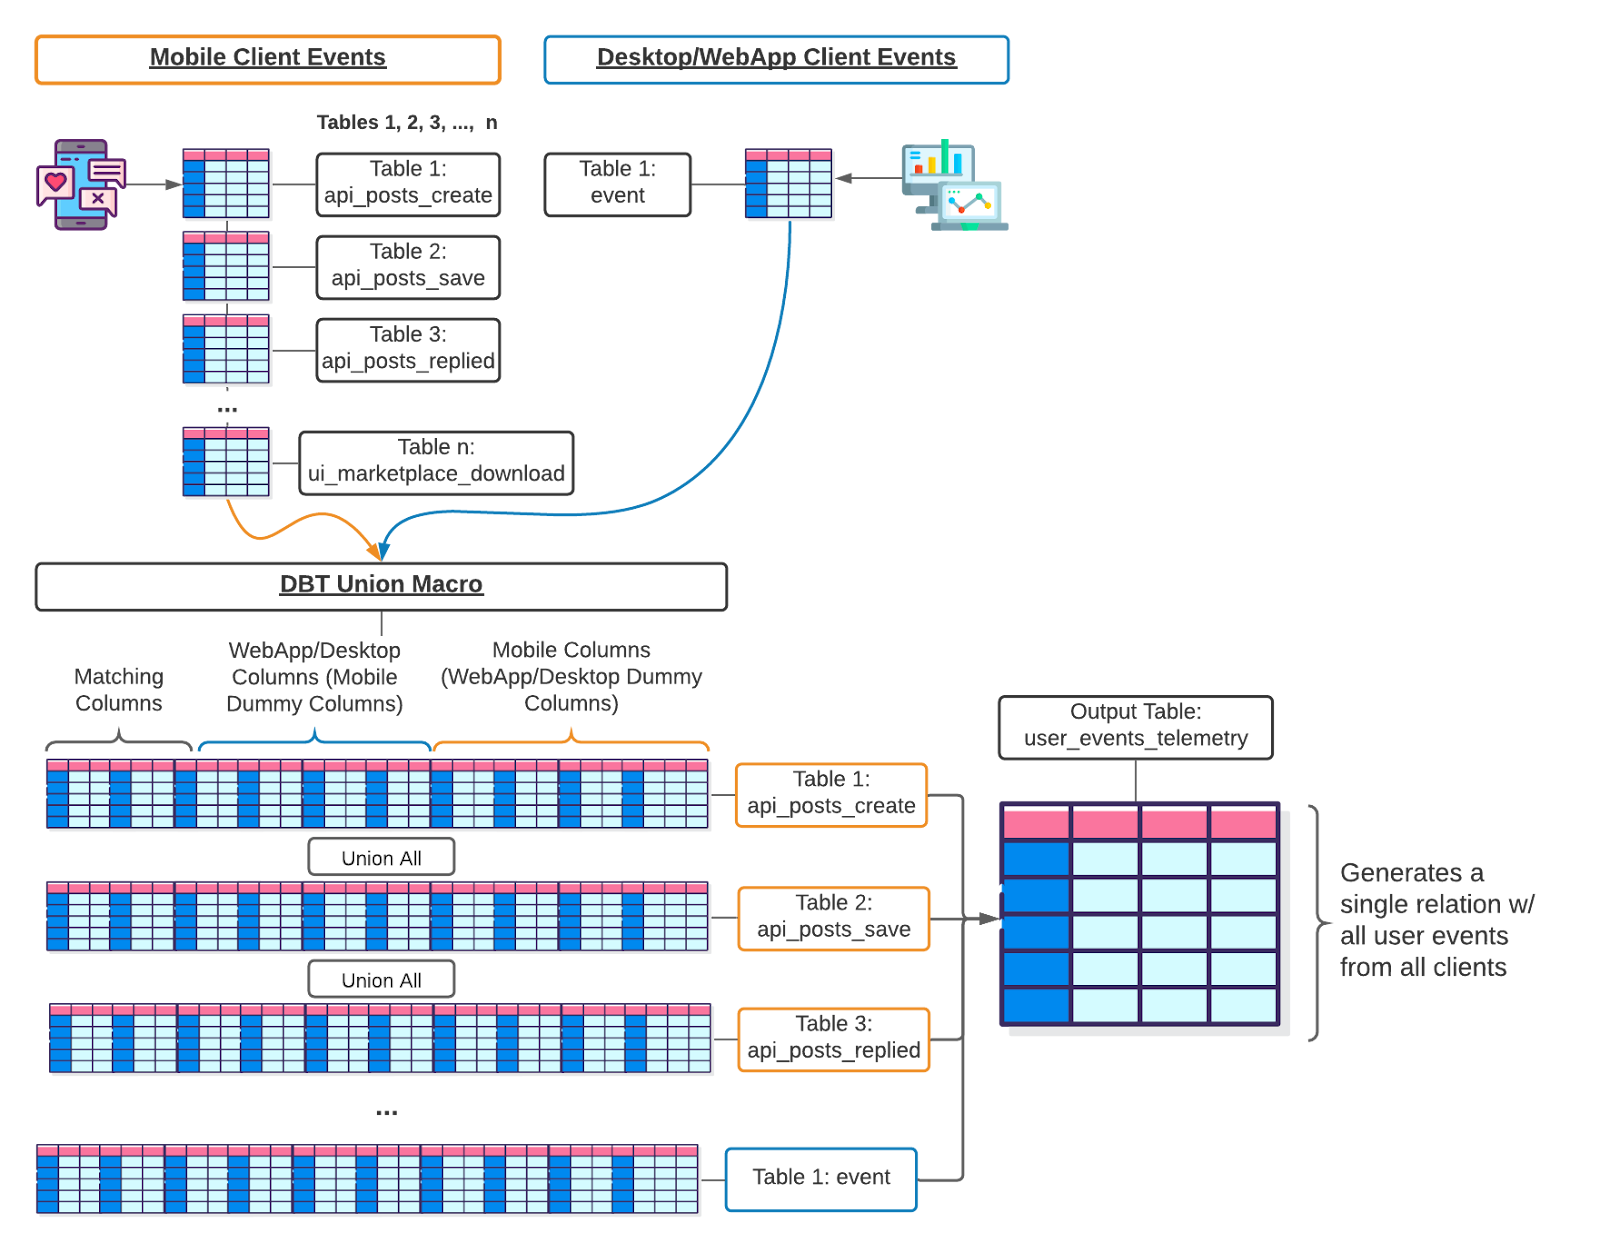
Image 1 (above): The image above demonstrates how the macro receives relations as arguments (top of image), creates column supersets (lists) that contain the overlapping (matching) columns, as well as table-specific columns, with added logic to create dummy columns for tables not containing columns (bottom left of image), and finally output the end result as a single table (bottom right of image).
I had the roadmap, and now it was time to put in the work. There was only one problem: I was completely unfamiliar with Jinja2 and dbt syntax. Thankfully, Fishtown Analytics is an open source company with solid documentation. I was able to peruse their library of macros and documentation to familiarize myself with formatting, syntax, and output logs for testing. After hacking my way through several hours of macro coding, I finally began producing outputs that resembled my objective. The light at the end of the tunnel grew nearer. And after several business days worth of work, I had it up and running!
It was clunky at first, but I fine-tuned it to fit my needs as weeks progressed. I cut the amount of time I spent updating and maintaining data models in half. The scripts it now produces are both long and elegant. Scripts that would take an unbelievable amount of time to create and maintain by hand.
For example, one of the hourly jobs utilizing the macro transforms and unions a set of over 100 relations in our raw mobile events schema. The final product is a single table in our production events schema. All of this is accomplished with only ten lines of code. Only two of which are actually calling the macro.
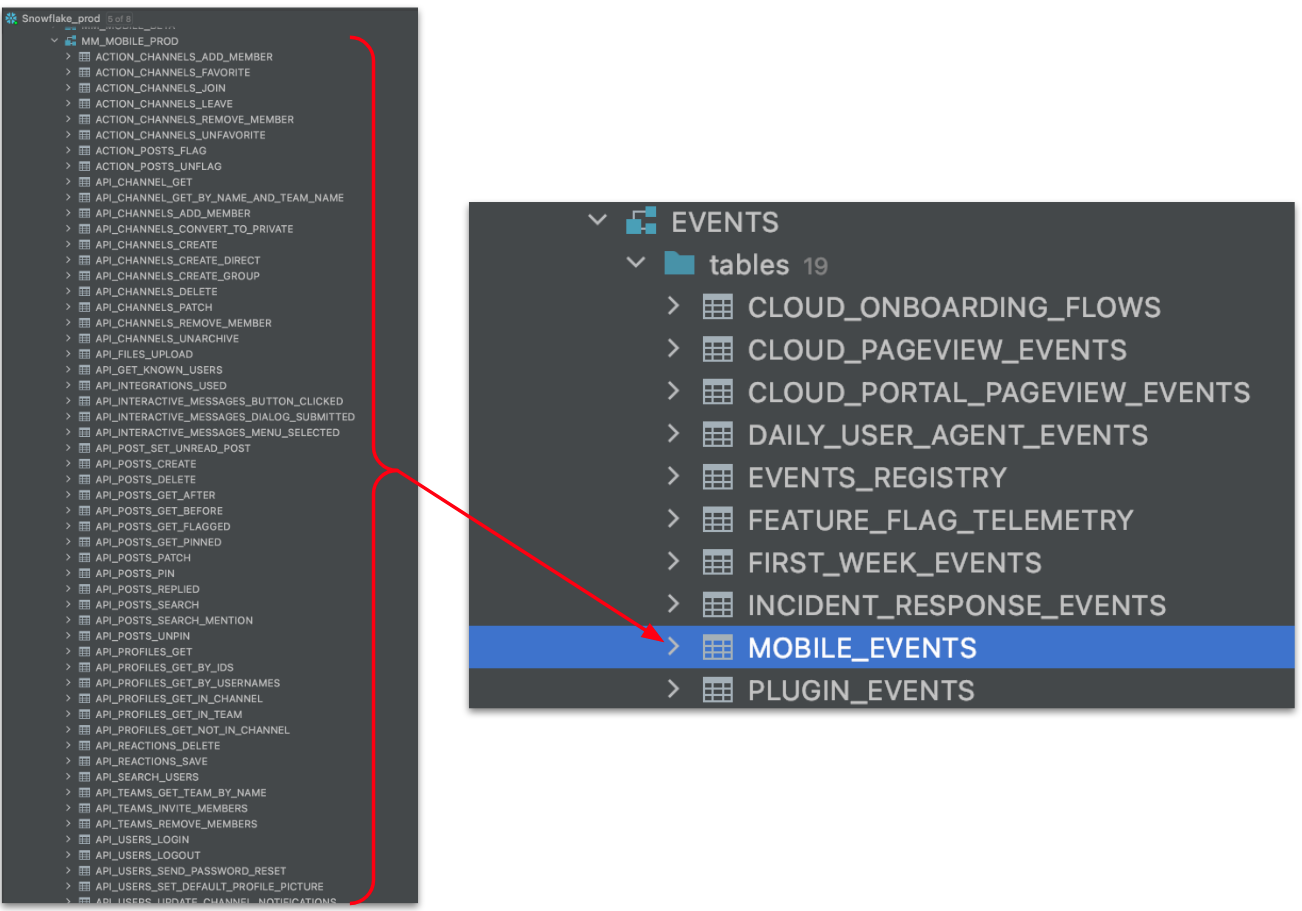
Image 2 (above): The left shows the raw mobile event schema and the relations that store user data for each distinct mobile event. The right shows the MOBILE_EVENTS relation, which is the cleaned and unioned version of all the relations shown on the left.
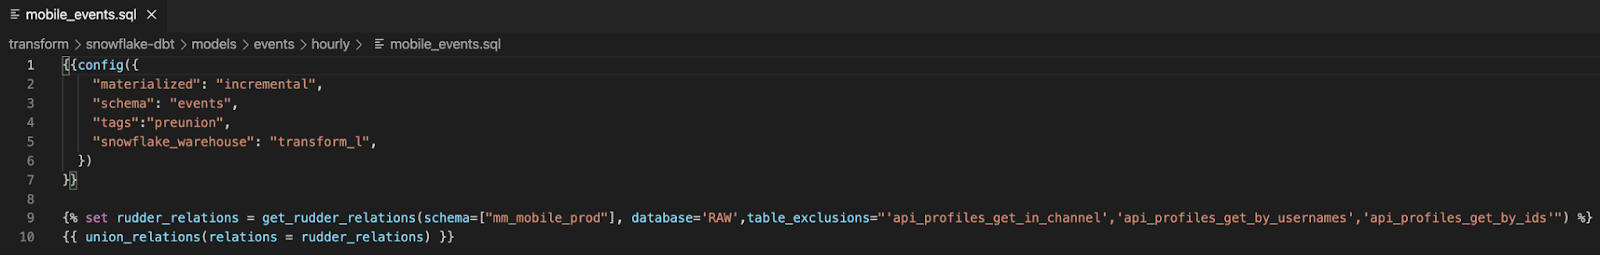
Image 3 (above): Shows the ten lines of generously spaced code required to execute the macro and union more than 100 tables.
Unlocking a New Generation of Data Analytics
I offer this information not to bask in my own glory, but to provide hope to Analysts, Data Engineers, and Analytics Engineers laboring endlessly on work that could, and should, be automated. We’ve reached a point, technologically speaking, where plain SQL just doesn’t cut it. We need to advance data and analytics engineering using the newest tools and programming languages available to us.
The experiences building macros and sharing my learnings with others have given me a new appreciation for the beauty of modern software and human ingenuity. An entirely new profession that bridges the gap between Analyst and Data Engineer has begun to emerge: the Analytics Engineer. The delineation between Analysts and Data Engineers has been blurring for some time, and it’s software like Rudderstack & dbt that supply Analytics Engineers with the tools to keep up with the rapid growth of data across organizations while avoiding data engineering department SLA’s. Ultimately, saving everyone, from the developer instrumenting an event to the business stakeholder visualizing the latest trends, time, and money.
Acknowledgments
A huge thank you to the Rudderstack team for hosting me on their webinar series. They’re doing amazing work to simplify customer analytics that needs to be acknowledged. You can learn more about them at rudderstack.com. I also recommend checking out dbt — whether you’re an aspiring data and analytics professional or just interested in up-leveling your data and analytics engineering skills. You can learn more about dbt at getdbt.com.
And my final plug – You can check out the webinar discussed earlier in this blog here!