Optimizing Database Connection Loads With PgBouncer and Testwick
The majority of engineers know that a minor misconfiguration might lead to some big troubles. Usually, we tend to forget the importance of that tense when we are configuring a new tool or a new service, as our focus is initially to make the tool functional and to evaluate if it fits our needs. Mattermost Cloud hosts thousands of workspaces which each one needs to have a different database backend, as in Mattermost we think that isolation is one very important aspect in our security guidelines. Given the amount of the workspaces and their respective backends, there are tens of thousands of connections to databases, which could cause issues to the infrastructure. For that reason, a connection pooler was introduced between the workspaces and their backends. Since we are using mainly PostgreSQL, PgBouncer was selected as it fits our needs for a lightweight connection pooler.
After deploying PgBouncer into production, and having it running successfully for a month, we started seeing some issues with PgBouncer and high CPU load which caused the RDS’ to scale out. There was an increase in the customer signups, but we expected, since we have PgBouncer in place, to not exhaust the resources so quickly. This scaling-up increased our operating cost, and we wanted to investigate why this happened.
Investigating Misconfigurations With Pgbouncer
Our first action was to go through the AWS support, to get some insights into why this CPU increase happened. Their response was that based on their internal connection metrics, our application is opening new connections and disconnecting them immediately, causing PostgreSQL server to use a high amount of CPU as Postmaster requires CPU and memory resources for creating new connections. Also, they suggested that we use PgBouncer! In order to maintain the same number of connections and to reduce the overhead of opening and closing connections and maintaining many open connections. The fun fact was that we were already using PgBouncer, and it was the culprit which was causing these connections and disconnections, which means that probably we had misconfigured PgBouncer, and we were not getting the results that we thought initially.
Our train of thought said that since we have a lot of connections and disconnections; this means that there is a race condition from PgBouncer pools for getting the available physical connections that each logical database has towards the RDS cluster. PgBouncer’s configuration was:
pool_mode = transaction
min_pool_size = 20
default_pool_size = 20
reserve_pool_size = 5
max_client_conn = 10000
max_db_connections = 20
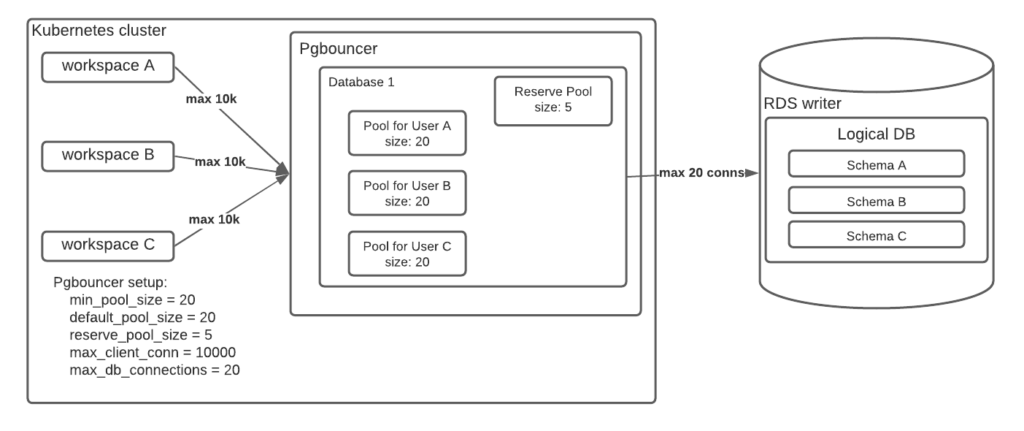
And in each logical database, we are having 10 to 15 workspaces. That configuration can be seen in the diagram below:

The `min_pool_size` and `default_pool_size` are set to 20, which means that every workspace gets 20 connections for its pool from the maximum 20 connections (`max_db_connections`) that all the pools need to share. This means that we have 10 to 15 workspaces competing with each other for getting all the available physical connections (20) every time they want to connect to the DB. In other words, each workspace can use 20 connections, but only 20 are allowed in total. So in that way we will always have conflicts, requiring PgBouncer to close and open backend connections quickly, which actually was wasting resources and caused high CPU load on RDS.
Enter Testwick: Our Custom Solution to Simulate Server Load
Next steps, in order to relieve the RDS clusters, were to reduce with that PR the `min_pool_size` and `default_pool_size` from 20 to 5 and increase at the same time the `max_db_connections` from 20 to 100. To test our hypothesis we used our custom tool which is called Testwick which creates workspaces and sends messages and posts. The results showed some improvement, as we managed to reduce the CPU load as we expected. But the question now was what is the proper ratio of size for each pool and the number of the total connections for each logical database (`max_db_connections`). Thus, a new task was created to find the best combination of pool sizes and max DB connections.
Our goal, with the extensive testing, was to find the appropriate configuration for PgBouncer that reduces CPU usage from disconnections/reconnections. For that purpose, we used Testwick and we started changing the configuration of PgBouncer. The parameters that we experiment with were:
- Default pool size
- Min pool size
- Reserve pool
- Reserve pool timeout
- Number of workspaces per logical DB
- Max connections per logical DB
Initially, we tried to replicate the current configuration that we had in the production environment, which caused the issues. After that, we were tweaking one parameter at a time, to find which will reduce the CPU usage. Firstly, we tweaked the first 4 parameters to find a good starting point before continuing to the next ones. The combination of the parameters that we came up with are:
- Default pool size → 5
- Min pool size → 1
- Reserve pool → 20
- Reserve pool timeout → 1
The reserve pool exists as an additional pool to the regular ones which is accessed in case there is a burst of clients who are trying to connect to the regular pools which are exhausted. With the above parameters, we decided to reduce the amount of each regular pool size, to increase the reserve pool size and at the same time to reduce the time that each pool has to access the reserve pool from 5 (default) to 1 second. Thus, in a case where clients need more connections to be able to access the reserve pool easier. Reducing the size of the min pool, reduced the CPU load as well, which makes sense as it requests by default fewer connections when a workspace connects to PgBouncer.
An Unexpected Turn Via go-morph
While testing with testwick, we noticed that some new workspaces were failing to start. After some investigation, we found migrations in mattermost were failing. A little of background here, Mattermost application for its database migration uses the library golang-migrate which creates a `pg_advisory_lock` so that to avoid 2 instances of Mattermost (when running in HA mode) to run both the migration. The issue that arose was due to `pg_advisory_lock` that is used from the library works in session mode, while we have configured PgBouncer to work with transaction mode. So in practice, there was an initial lock-in the DB for `pg_advisory_lock` and the session was lost. Then it was impossible for the library to remove that lock and the application was hanging there, causing restarts which created more locks as the initial lock was still there.
Reverting the PgBouncer in session mode worked without a problem, but the rest of Mattermost application uses transaction queries, and we would not be getting any advantage of PgBouncer’s multiplexing feature. We decided with the rest of the team to start using go-morph as a library for migrations and to start moving out from golang-migrate. This approach will solve our problem in the future, but it will not help us immediately. Hence, we found a new configuration parameter for PgBouncer that will help us as a midterm solution, and that setting is `server_reset_query_always`. This setting, as the PgBouncer configuration manual states: is a workaround for broken setups that run applications that use session features over a transaction-pooled PgBouncer. This was our last magic parameter that was set to help us run smoothly from now on until we hit a new issue.
How We Used Kibana to Dial in Our Configuration
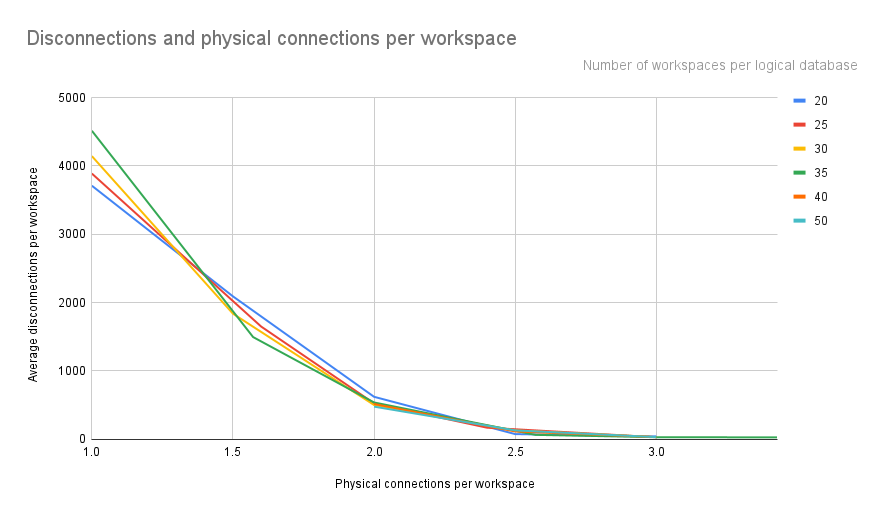
The disadvantage of checking only the CPU was that at some tests, due to the heavy load that each workspace had, might have misleading results. Hence, we had to create a new index that will help us identify which configuration will reduce the CPU load, without taking into account the load of each workspace as each one was sending around 1000 messages. That new index we wanted to measure the amount of connections and disconnections, as that was the indicator that was causing us high CPU load. So, we enabled logging in RDS for `log_connections` and `log_disconnections` in RDS and we managed to expose cloudwatch to our Kibana so that to count the number of logs for the disconnections and connections with a dashboard in Kibana. Both disconnections and connections on every test/run were almost similar, so we decided to select disconnections for the index. Each test/run has a different number of workspaces, so in order to compare these numbers we divided the disconnections with the workspaces so to get an average of disconnections per workspace.

The numbers on the right show the number of workspaces that exist in each logical database. So, no matter how many workspaces there are, the trends are clear, that when there are 2.5 physical connections per workspace, the disconnections per workspace minimize to almost 0. This means that when there is a logical database that has 20 workspaces, it should have more than 50 (20 multiplied with 2.5x) max connections per logical database. A different example is that when there are 50 workspaces, the max connections per logical database should be more than 125.
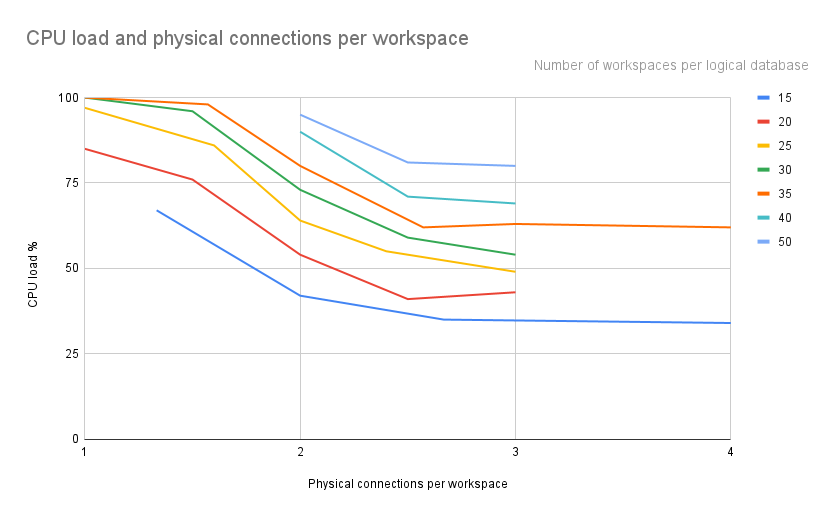
A second hurdle was to visualize the relationship between the number of workspaces per logical DB, the max connections per logical DB and the CPU load. So we decided to create a new index between the first two parameters, which will show how many physical connections will correspond to each workspace. Then it will be easier to compare CPU load with the new index physical connections per workspace.

On the graph above, the numbers on the right show the number of installations that exist in each logical database. The lines show a similar trend, as each line is an offset of the previous ones. This makes sense as in each line we have the same amount of workspaces and as we increase the workspaces (e.g., from 15 to 20) we create more load on the CPU, which explains that offset. The trends show that with more than 2.5-3 connections per installation, the CPU % usage starts to stabilize and not reduce any more. This, in accordance with the previous graph, shows that the high CPU load from 1 until the 2.5 physical connections per workspace is high due to the high amount of disconnections that the database has. After that point of 2.5 physical connections per workspace, the CPU does not reduce any further due to the load that is created from testwick as all the workspaces send 1000 messages which creates a lot of pressure into the database by itself.
Conclusion
It can be concluded from the graphs that having 2.5 physical connections per workspace is a safe choice for our environment in order to minimize the amount of disconnections/reconnections. But we need to keep in mind that these tests were using the workspaces at full load, by keeping sending 1000 messages every 0.5 second. So, we are thinking that we can still use 2 or even 1.5 physical connections per workspace as rarely there will be load on all workspaces simultaneously.


