How We Use Sloth to do SLO Monitoring and Alerting with Prometheus
One of the most challenging tasks for Site Reliability Engineers is to align the reliability of the systems with the business goals. There is a constant battle between delivering more features—which increases the product’s value—and keeping the system reliable and maintainable. A significant ally to achieve both objectives is the Service Level Objective Framework.
In this post, I’ll explain why and how we implemented our Service Level Objective Framework, including the tools we use for SLO monitoring, and a look at our plans for the future.
Terminology
Before we dive in, there are a few terms that are important to know:
Service Level Indicator (SLI): A carefully defined quantitative measure of some aspect of the level of service provided, e.g., Availability, Latency, Freshness.
Service Level Objective (SLO): A target value or range of values for a service level that is measured by an SLI. A natural structure for SLOs is thus SLI ≤ target, or lower bound ≤ SLI ≤ upper bound.
Service Level Agreement (SLA): An explicit or implicit contract with your users that includes consequences of meeting (or missing) the SLOs they contain. The consequences are most easily recognized when they are financial—a rebate or a penalty—but they can take other forms. An easy way to tell the difference between an SLO and an SLA is to ask, “What happens if the SLOs aren’t met?”
Metric: An identifier linking data points together over time.
Choosing the Tools to Drive Reliability Goals
Our objective by adopting SLI Monitoring and SLO Alerting is to drive our monitoring and alerting by our reliability goals.
In the first phase of our implementation, we decided to apply this framework to our customer-facing applications: the Mattermost server and the customer web server. In the next phases, we will extend it across all our internal services.
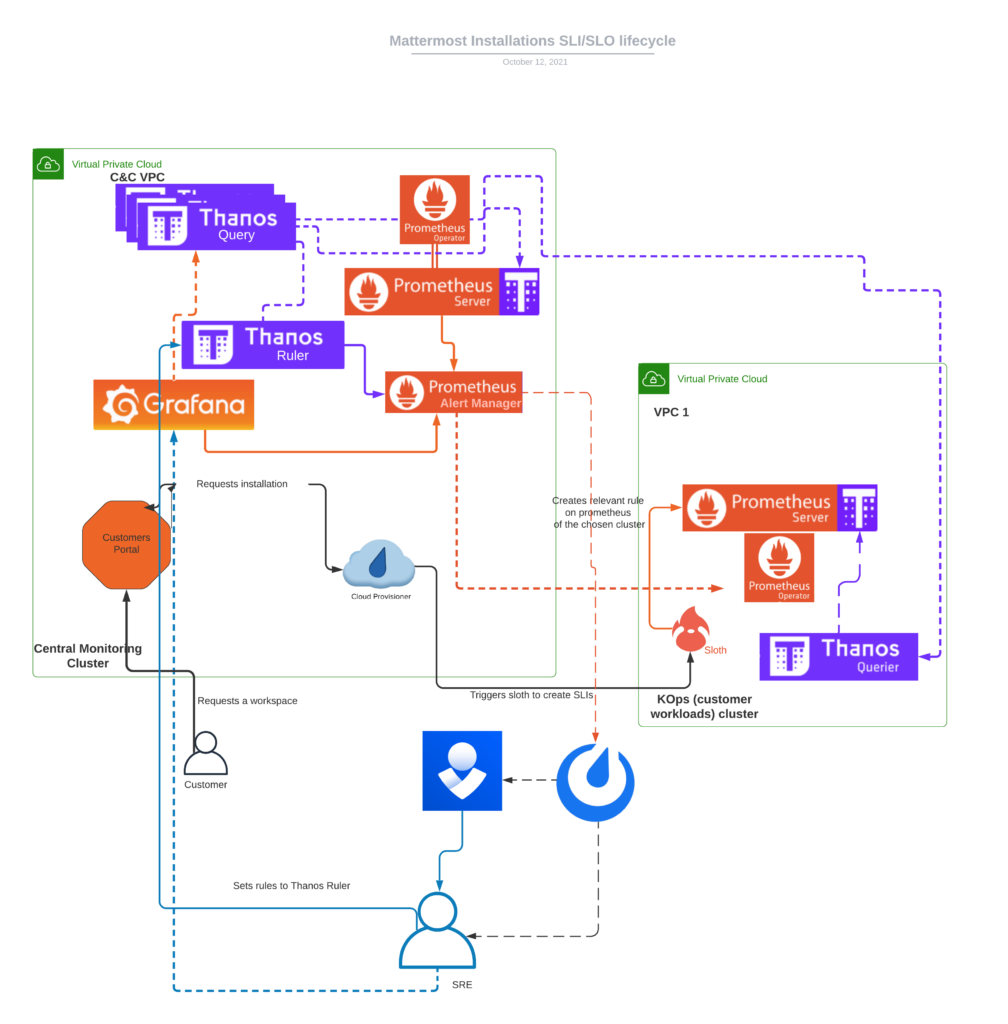
To apply SLI Monitoring, we used a tool/library called sloth which standardizes and makes it easier to generate SLOs for Prometheus. We also leveraged our HA Monitoring Infrastructure with Prometheus, Alertmanager, Thanos, and Grafana. Thanos ruler evaluates rules and sends alerts to Alertmanager. Alertmanager has integrated notifications and alerts with our Mattermost Community Server and OpsGenie.
How We Built an SLO Monitoring and Alerting Prototype
Our prototype for this new way of Monitoring and Alerting started the implementation from our most important app: mattermost-server. We were able to have SLIs and SLOs in place for all our Cloud Customers’ Workspaces. In addition to deploying sloth across all our workloads’ clusters, we needed to integrate sloth as a library to our cloud provisioner to add SLIs and their concomitant SLOs on every Mattermost Workspace that runs on our cloud infrastructure.
We chose availability as the first SLI. To measure this SLI, we chose as metric the Error Rate, represented as the following formula:
Error Rate =Error Requests/ Total Requests
The Prometheus queries which represent the Errors and the Total Requests in our case are shown below:
| Errors | sum(rate(mattermost_api_time_count{job=’$ingress-id’’,status_code=~'(5..|429|499)’}[{{.window}}])) |
| Total | sum(rate(mattermost_api_time_count{job=’$ingress-id”}[{{.window}}])) |
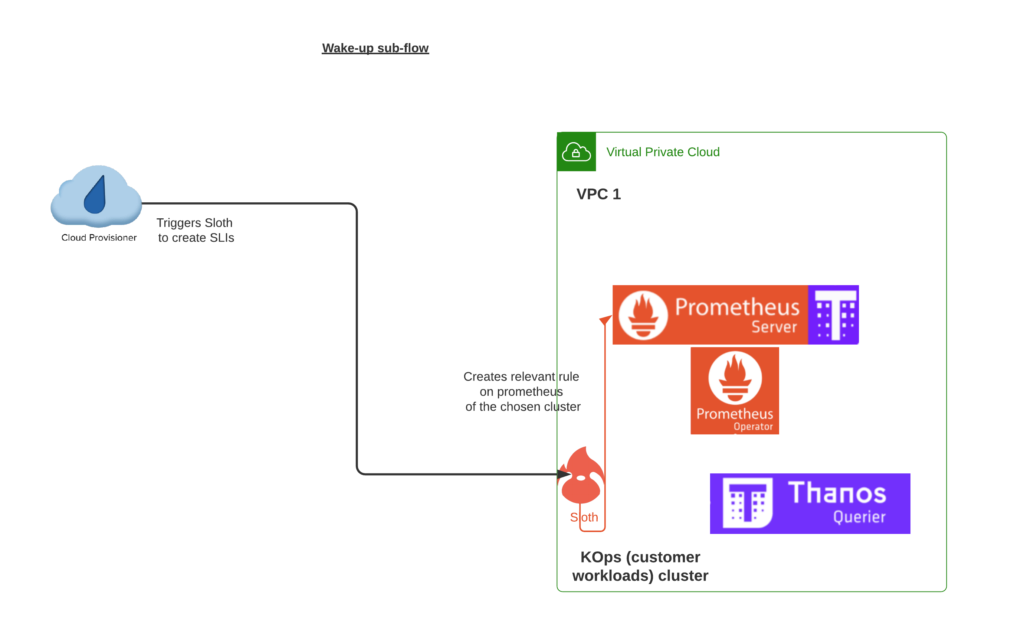
So when a new workspace gets created, the cloud provisioner’s integration with sloth creates the SLI/SLOs and then sloth applies the PrometheusRule. While sloth supports creating alerts too at the same time by default, we disabled this functionality by decision. Since we keep most of our alerting centralized on thanos ruler, we created a catchall alert for all workspaces. This way we leveraged our current existing integrations with Grafana, Mattermost Community Server notification system, and OpsGenie and avoided extra work needed to set it up again for multiple Prometheuses and Alertmanagers. Below there is a diagram of this setup:
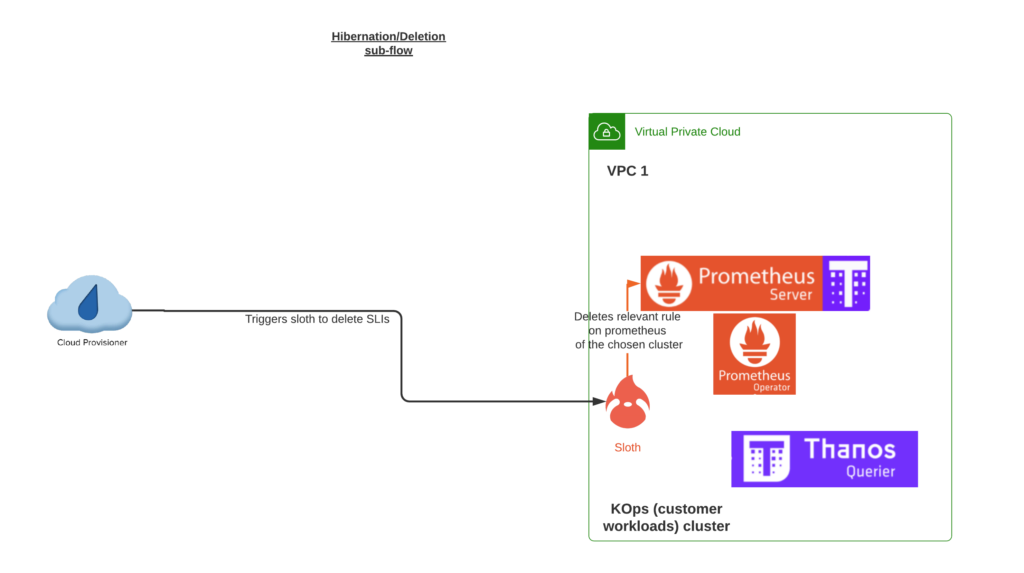
When a workspace gets hibernated or deleted, the provisioner deletes the SLI and sloth the relevant PrometheusRule object as shown below:
When a workspace wakes up from hibernation —or gets updated when previously it hasn’t had SLI in place— then the provisioner and sloth create the needed resources.
Other SLIs
After the successful completion of the prototype, we also deployed sloth with our ArgoCD infrastructure to our Command and Control clusters. We put SLIs in place for availability in two more services: Thanos and our Customer Portal. Our next goal is to put in place our first latency SLIs, which have their own challenges.
SLI Monitoring and SLO Alerting to Improve Customer Reliability
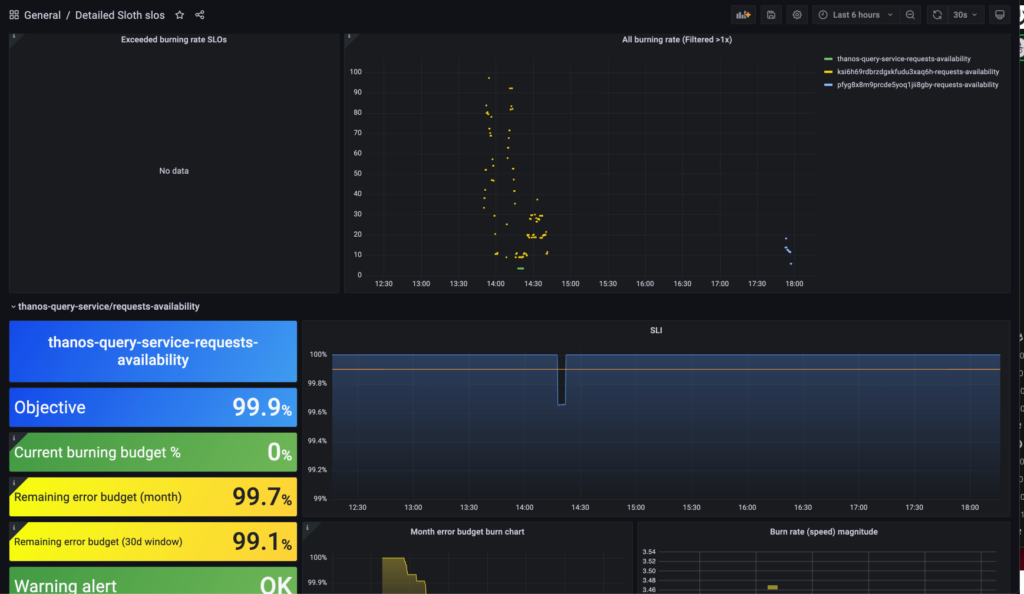
The reason we chose to adopt SLI monitoring is because it is really customer-centric. By monitoring indicators related with end user experience we are able to observe in one glance how many services and customers are affected by an incident, and how seriously they are impacted.
The following dashboard is really clear; the density and the number of dots of each color indicate which service or customer is affected, so the Reliability and the software teams can dig into the problem faster and more effectively.
As we mentioned above, we created catchall alerts for all services in Thanos ruler and alerts for Thanos itself on Prometheus. This addresses the problem of monitoring the monitor. So we get a page and a notification when the burn rate is in the “critical” severity, and a notification only for “warning” severity. We followed the sixth iteration from “The Site Reliability Workbook,” which is called Multi-Window, Multi-Burn-Rate alerts.
| Alert | Long Window | Short Window | Burn Rate | Error Budget Consumed |
|---|---|---|---|---|
| Critical (Page) | 1 hour | 5 minutes | 14.4 | 2% |
| Critical (Page) | 6 hours | 30 minutes | 6 | 5% |
| Warning (Notification) | 1 day | 2 hours | 1 | 10% |
| Warning (Notification) | 3 days | 6 hours | 1 | 10% |
This has two great ideas:
- Multi-window: Each alert fires if the SLO error rate times the burn rate factor is exceeded when averaged over both the long window and the short window. The short window ensures a short reset time of the alert, it stops firing very soon after the problem is solved, but also allows for paging to happen again if the problem comes back within the long window.
- Multi-burn-rate: Enable pages for fast burning of the monthly error budget and notifications for slow burning of the budget.
In the table below we can see the query representation of our generalized alerts.
| Query | Severity |
|---|---|
| ((slo:sli_error:ratio_rate2h{sloth_slo=”requests-availability”} > (3 * 0.0009999999999999432)) and ignoring(sloth_window) (slo:sli_error:ratio_rate1d{sloth_slo=”requests-availability”} > (3 * 0.0009999999999999432))) or ignoring(sloth_window) ((slo:sli_error:ratio_rate6h{sloth_slo=”requests-availability”} > (1 * 0.0009999999999999432)) and ignoring(sloth_window) (slo:sli_error:ratio_rate3d{sloth_slo=”requests-availability”} > (1 * 0.0009999999999999432))) | Warning |
| ((slo:sli_error:ratio_rate5m{sloth_slo=”requests-availability”} > (14.4 * 0.0009999999999999432)) and ignoring(sloth_window) (slo:sli_error:ratio_rate1h{sloth_slo=”requests-availability”} > (14.4 * 0.0009999999999999432))) or ignoring(sloth_window) ((slo:sli_error:ratio_rate30m{sloth_slo=”requests-availability”} > (6 * 0.0009999999999999432)) and ignoring(sloth_window) (slo:sli_error:ratio_rate6h{sloth_slo=”requests-availability”} > (6 * 0.0009999999999999432))) | Critical |
Taking This Work Further
Applying SLO framework across our Cloud infrastructure will not be either a small or easy journey. We have just started our baby steps on it, and there is a lot more work to be done. We continue defining more SLIs to the services we already have and to them we don’t have. We improve our metrics across all services, by adding new ones where needed. The goal is to run all our services, both customer-facing and internal with SLIs and SLOs.
To achieve this we are going to do small iterations until we have a layered monitoring and alerting approach. We also need to define some cross services and cross cluster SLIs. Last but not least, this initiative that started from the Cloud SRE team has to involve more teams, improves ownership and increases the culture of shared responsibility. Since it is a paradigm shift, it cannot be achieved only with technical changes but needs cultural evolution.
Acknowledgments
We need to thank Xabier Larrakoetxea (Twitter handle: @sLoK69), creator and major contributor of the Sloth project for his continuous support in any question we had regarding Sloth and SLOs during our implementation.
References
- Implementing Service Level Objectives [Book]
- Site Reliability Engineering. How Google runs production systems
- The Site Reliability Workbook: Practical Ways to Implement SRE
- slok/sloth: 🦥 Easy and simple Prometheus SLO (service level objectives) generator
- Our journey towards SLO based alerting: Implementing SRE workbook alerting with Prometheus only
- Alerting on SLOs like Pros | SoundCloud Backstage Blog