Easy Kubernetes metrics and cluster management with K9s, Kubectx, and Kubens
Efficiently retrieving Kubernetes metrics is the beginning of cluster performance optimization. Cluster metrics such as logs and resources descriptions are crucial as they map the health of your cluster.
There’s a Kubernetes tool called K9s that lets you access your Kubernetes cluster metrics swiftly using short keys. K9s prioritizes aesthetics and performance as it displays its contents and functions in an aesthetically pleasing UI.
In this tutorial, you will learn how to boost your Kubernetes (DevOps) productivity using K9s and Kubectx, which is a tool that lets you switch between multiple clusters. This article will cover the following steps:
- Create a Kubernetes Cluster with Minikube
- Use K9s to Evaluate Cluster Metrics
- Use Kubectx and Kubens to Quickly Switch between Namespaces and Clusters
Prerequisites
Before getting started with this guide, please review take a look at this prerequisite setup information.
- Give Powershell administrator rights before using Minikube or K9s.
- Install Kubectl from here (or here, for macOS) if you have not installed it yet.
- Install Chocolatey from here if you have not installed it yet.
Install Docker desktop from here.
Create a Kubernetes Cluster with Minikube
Minikube is a tiny Kubernetes implementation that creates a local VM and deploys a simple cluster containing just one node. Minikube is a fantastic way to learn the principles and commands behind Kubernetes before attempting on a larger project. Getting started in Kubernetes can have a high barrier, so Minikube exists to try and bridge the gap and make the technology more accessible to learn and master.
Before we can fetch cluster logs using K9s, let’s create a cluster using Minikube, which is a Kubernetes distribution used to create clusters locally. Note that these instructions are for Windows; for macOS instructions, please go here.
Use the following command to install Minikube on your Windows computer:
New-Item -Path 'c:\' -Name 'minikube' -ItemType Directory -Force
>> Invoke-WebRequest -OutFile 'c:\minikube\minikube.exe' -Uri 'https://github.com/kubernetes/minikube/releases/latest/download/minikube-windows-amd64.exe' -UseBasicParsing
After Minikube has been installed successfully, add the binary path using the following command:
$oldPath = [Environment]::GetEnvironmentVariable('Path', [EnvironmentVariableTarget]::Machine)
if ($oldPath.Split(';') -inotcontains 'C:\minikube'){ `
  [Environment]::SetEnvironmentVariable('Path', $('{0};C:\minikube' -f $oldPath), [EnvironmentVariableTarget]::Machine) `
}
Use the following command to create a cluster and set Docker as the driver:
minikube start --driver=dockerAfter your cluster has been created successfully, you’ll get the following output:
* Done! kubectl is now configured to use "minikube" cluster and "default" namespace by defaultIf you need help or more clarity when using Minikube, use the minikube --help command to get all the available commands. Here’s the output of available commands:
minikube provisions and manages local Kubernetes clusters optimized for development workflows.

Basic Commands:
  start          Starts a local Kubernetes cluster
  status         Gets the status of a local Kubernetes cluster
  stop           Stops a running local Kubernetes cluster
  delete         Deletes a local Kubernetes cluster
  dashboard      Access the Kubernetes dashboard running within the minikube cluster
  pause          pause Kubernetes
  unpause        unpause Kubernetes

Images Commands:
  docker-env     Configure environment to use minikube's Docker daemon
  podman-env     Configure environment to use minikube's Podman service
  cache          Add, delete, or push a local image into minikube
  image          Manage images

Configuration and Management Commands:
  addons         Enable or disable a minikube addon
  config         Modify persistent configuration values
  profile        Get or list the current profiles (clusters)
  update-context Update kubeconfig in case of an IP or port change
To be able to see metrics using K9s, let’s create the Pod and Deployment objects. Let’s start by organizing our cluster by creating a namespace called mattermost which will carry the pod and deployment objects. Use the following command to create a mattermost namespace:
kubectl create namespace mattermostNow, let’s create a YAML file called pod-example.yaml which creates a pod called pod-example that has the following contents shown below:
apiVersion: v1
kind: Pod
metadata:
  name: pod-example
  namespace: mattermost
spec:
  containers:
  - name: app
    image: gcr.io/google-samples/gb-frontend:v4
    resources:
      requests:
        memory: "64Mi"
        cpu: "250m"
      limits:
        memory: "128Mi"
        cpu: "500m"
Use the following command to create it:
kubectl apply -f pod-example.yamlNext, create a YAML file called new-deployment.yaml which will create a deployment object. Add the following contents to the new-deployment.yaml file:
apiVersion: apps/v1
kind: Deployment
metadata:
  name: boemo
  namespace: mattermost
  labels:
    app: boemo-app
spec:
  replicas: 1
  selector:
    matchLabels:
      app: boemo-app
  template:
    metadata:
      labels:
        app: boemo-app
    spec:
      containers:
      - name: server
        image: nginx:1.17
        volumeMounts:
          - name: boemo-app
            mountPath: /usr/share/nginx/html
        ports:
        - containerPort: 80
          protocol: TCP
        resources:
          requests:
            cpu: 100m
            memory: "128M"
          limits:
            cpu: 100m
            memory: "256M"
        env:
        - name: LOG_LEVEL
          value: "DEBUG"
      volumes:
      - name: boemo-app
        configMap:
          name: boemo-app
          items:
          - key: body
            path: index.html
Use the following command to apply the above resource:
kubectl apply -f new-deployment.yamlUse K9s to Evaluate Cluster Metrics
K9s is a CLI and terminal UI that makes interacting with your Kubernetes clusters a breeze. The tool makes it easier to navigate and manage your deployed applications, wherever they might live. It monitors your clusters and provides tools to help you troubleshoot any potential problems. You can learn more about K9s on its official website.
Install K9s on Windows
In this section, you’ll learn how to install K9s on Windows. For Mac instructions, visit this page. The K9s UI terminal can be accessed using Powershell or your favorite command line. Use the following command to install K9s using Chocolatey on Windows:
choco install k9sApprove multiple Chocolatey requests whenever prompted to do so:
Do you want to run the script?([Y]es/[A]ll - yes to all/[N]o/[P]rint): yYou will get the following message which gives you the installation location of K9s when K9s has been installed successfully:
 The install of k9s was successful.
  Software installed to 'C:\ProgramData\chocolatey\lib\k9s\tools'

Chocolatey installed 2/2 packages.
 See the log for details (C:\ProgramData\chocolatey\logs\chocolatey.log).
Use the following command to get the K9s version installed:
k9s versionYou will get the version, commit, and date as output if K9s has been installed successfully:
Version:    v0.25.18
Commit:     6085039f83cd5e8528c898cc1538f5b3287ce117
Date:       2021-12-28T16:53:21Z
Fetch Cluster Metrics
To be able to fetch cluster metrics from our cluster using K9s, we have to enable the metrics-server addon using the following command:
minikube addons enable metrics-serverAfter enabling the add-on, open your favorite CLI and type the following command to launch the K9s UI terminal:
k9s You will get the following output that shows the K9s terminal has been launched and the Minikube cluster we created earlier:

As you can see above, K9s has listed all the important commands and shortcuts. On top of that, it has listed all default and non-default namespaces in the table. If you click on any namespace, K9s will navigate to the selected namespace.
Interact with Your Cluster
There are many commands in K9s, which you can learn about here. But below are some of the most important K9s commands you might come across:
| Command | Explanation |
|---|---|
| k9s -c pod | Use this command to run K9s and launch in pod view |
| k9s help | Use this command to list all available CLI options |
| k9s info | Use this command to get information and details about K9s runtime |
| k9s -n my-namespace | Use this command to run K9s in a given namespace |
Collect Cluster Logs
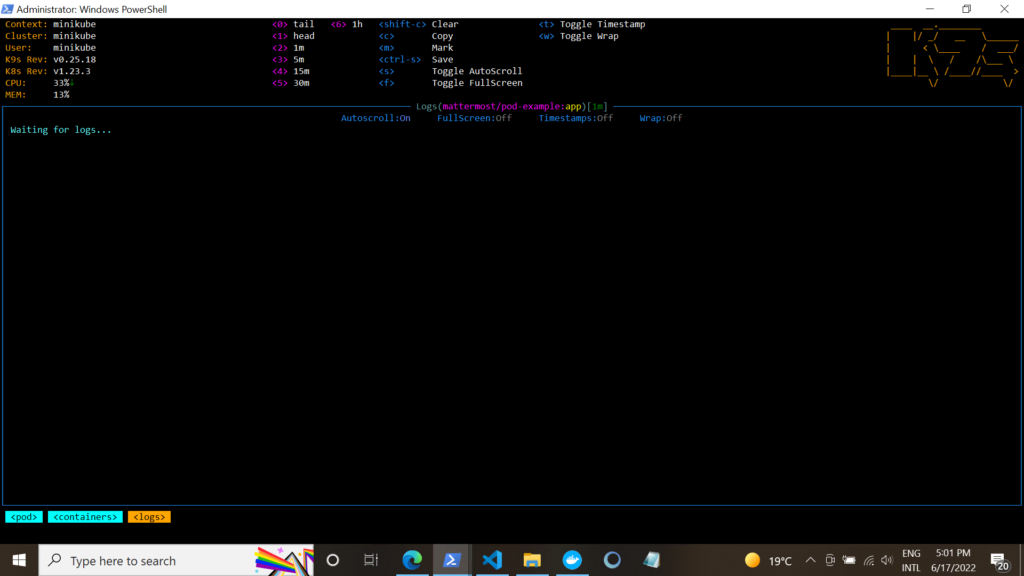
Not inspecting logs and insufficient logging is one of the most known vulnerabilities in the OWASP top 10 security list. By just inspecting logs, you can spot errors and vulnerabilities that could cause chaos if exploited. K9s allows you to view your namespace’s logs by clicking the l key on your keyboard.
Navigate to the pod we created earlier in the mattermost namespace and press l to see the logs. This time, you will get nothing:
However, if you press 1, you will get the following output. You will get more logs as you manage and regulate your cluster:
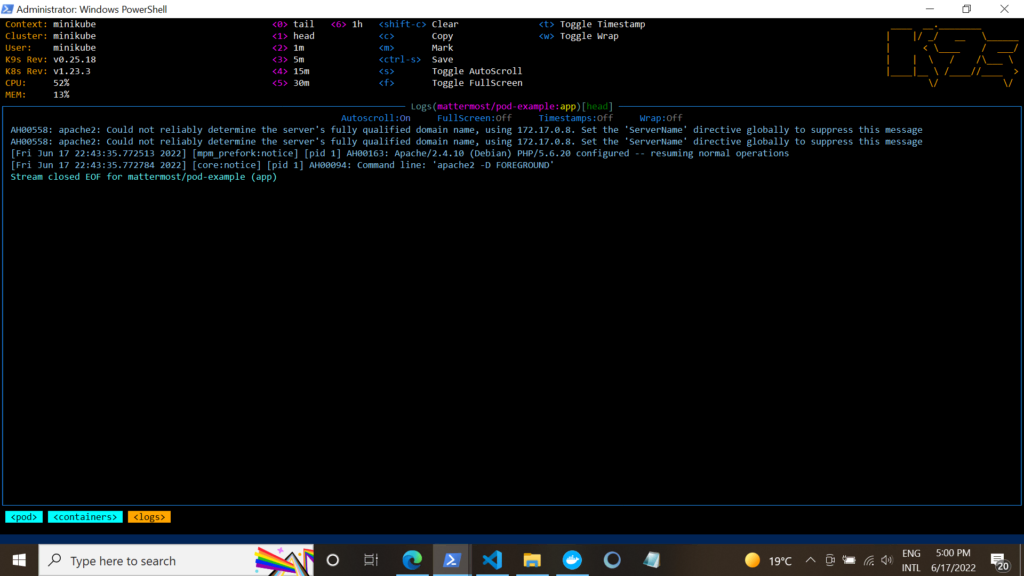
Press the letter c on your keyboard if you want to copy the logs. Also, K9s allows you to sort logs in a time range by pressing numbers on your keyboard:
| Number | Time range |
|---|---|
| 1 | Gives you all logs over the last minute. |
| 2 | Gives you all logs over the last 5 minutes. |
| 3 | Gives you all logs over the last 15 minutes. |
| 0 | Gives you all logs over the entire lifetime of the pod. |
| 4 | Gives you all logs over the last 30 minutes. |
Use K9s Pulses to Measure Application Health
K9s has a feature called pulses which gives you Deployment, Statefulsets, Replicasets, and Daemonstest metrics. Pulses allow you to measure the health of your applications and the events happening inside and between them. When utilized, it acts as a high-level UI to display key details about a deployed cluster. You can watch a demo video about using K9s pulses here.
Type :pulses to get the metrics of deployment and statefulsets. K9s UI terminal commands always start with the colon (:). K9s will show that your cluster has one deployment and one pod that was created earlier on. You will get the following similar output:

If you select any resources shown in the pulses section. K9s will give you more information and you can press the d key to describe resources.
Update Cluster Manifest
K9s allows you to select manifest and edit them directly. All you have to do is click on the manifest and click the e letter on the keyboard to edit the manifest. K9s will open the manifest in a text editor or notepad. Now, you can edit the manifest and save it. Here’s the manifest that is opened in a notepad:
# Please edit the object below. Lines beginning with a '#' will be ignored,
# and an empty file will abort the edit. If an error occurs while saving this file will be
# reopened with the relevant failures.
#
apiVersion: v1
kind: Pod
metadata:
  annotations:
    seccomp.security.alpha.kubernetes.io/pod: runtime/default
  creationTimestamp: "2022-05-06T22:26:33Z"
  generateName: dashboard-metrics-scraper-58549894f-
  labels:
    k8s-app: dashboard-metrics-scraper
    pod-template-hash: 58549894f
  name: dashboard-metrics-scraper-58549894f-pmkmj
  namespace: kubernetes-dashboard
  ownerReferences:
  - apiVersion: apps/v1
    blockOwnerDeletion: true
    controller: true
    kind: ReplicaSet
    name: dashboard-metrics-scraper-58549894f
    uid: be8534e5-a22e-4caa-9e60-ec6ec6824d6c
  resourceVersion: "569"
  uid: 64649c06-cc7e-4754-abbe-a6170553487e
spec:
  containers:
  - image: kubernetesui/metrics-scraper:v1.0.7@sha256:36d5b3f60e1a144cc5ada820910535074bdf5cf73fb70d1ff1681537eef4e172
    imagePullPolicy: IfNotPresent
    livenessProbe:
      failureThreshold: 3
      httpGet:
        path: /
        port: 8000
        scheme: HTTP
      initialDelaySeconds: 30
      periodSeconds: 10
      successThreshold: 1
      timeoutSeconds: 30
    name: dashboard-metrics-scraper
If you have no intention of modifying your cluster resources and just want to view them, use the following command to disable cluster modification:
k9s --readonlyIf you want to delete resources, press ctrl + d:

Use Kubectx and Kubens to Quickly Switch Between Namespaces and Clusters
Kubernetes and the microservices architecture are a perfect combination you should use if you want to scale your applications to the highest level. However, the best things aren’t cheap as they come with complexity and require a well organized DevOps workflow.
This complexity is caused by multiple namespaces and unedless testing clusters created. Fortunately, there is a tool called Kubectx that lets you switch between clusters swiftly. Kubens is bundled with Kubectx and it is used to switch namespaces. This section will teach you how to use Kubectx and Kubens.
Install Kubectx
Use the following command to install Kubectx and Kubens on Windows using Chocolatey (for Mac instructions, head here):
choco install kubens kubectxChocolatey will ask for your permissions several times; press y to proceed with the installation procedure:
Do you want to run the script?([Y]es/[A]ll - yes to all/[N]o/[P]rint):After Kubectx and Kubens have been installed successfully, you will get the following output:
 The install of kubectx was successful.
  Software installed to 'C:\ProgramData\chocolatey\lib\kubectx'

Chocolatey installed 2/2 packages.
 See the log for details (C:\ProgramData\chocolatey\logs\chocolatey.log).
Switch Namespaces
Kubens and Kubectx go hand in hand; Kubectx switches clusters while Kubens switches namespaces. If you want to see all the available namespaces, use the following command:
kubectl get namespacesYou will get the following similar output:
NAME                   STATUS   AGE
default                Active   44d
kube-node-lease        Active   44d
kube-public            Active   44d
kube-system            Active   44d
kubernetes-dashboard   Active   44d
kyverno                Active   44d
mattermost             Active   2d1h
newmetric              Active   16d
Use the following command to switch to the mattermost namespace we created earlier:
kubens mattermostYou will get the following output:
✔ Active namespace is "mattermost"Use the following command to reverse to the previous namespaces:
$ kubens -You will get the following output if the default namespace was the previous namespace you accessed:
✔ Active namespace is "default"Switch Clusters
Kubectx will read the kubeconfig file and will change and switch based on the data it got from there. Use Kubectx later on — after you’ve created multiple clusters. In this tutorial, we’ve only created one cluster.
Therefore, use the following command to switch to another cluster that has been listed in the kubeconfig. Use this command if you created another different cluster:
kubectx [enter the name of your second cluster here]You will get the following similar output:
✔ Switched to context "kind-simple-application".When you want to return to the previous cluster, use the following command:
$ kubectx -Kubectx will switch to the previous cluster immediately:
✔ Switched to context "minikube".Learn More about Kubernetes
We hope you found this tutorial useful!
Whether you’re just getting started with Kubernetes, or want to stay on top of the latest tools to help you get more out of your K8s clusters, check out the rest of our Kubernetes articles to learn more.
This blog post was created as part of the Mattermost Community Writing Program and is published under the CC BY-NC-SA 4.0 license. To learn more about the Mattermost Community Writing Program, check this out.