
Building a custom Grafana dashboard for Kubernetes observability
Distributed systems open us up to myriad complexities due to their microservices architecture. There are always little problems that arise in the system. Therefore, engineering teams must be able to determine how to prioritize the challenges. Viewing logs and metrics of such systems enables engineers to know the shared state of the system components, thereby informing the decision-making on what challenge needs to be solved most immediately.
As the most widely used container management platform globally today, Kubernetes warrants some attention regarding practices for monitoring and observing the important data influencing its management and operation in production environments.
Watch a video tutorial on building your custom Grafana dashboard below, and read on to learn more about Kubernetes observability.
Observability
Observability is a function of a production system that describes the ability to understand the state of events in the system. Generally speaking, observability has three forms: monitoring, logging, and tracing.
Monitoring
Monitoring involves obtaining operational data about the current or past state of the system. Operational data includes applications, operating systems, and virtual or physical machines.
Logging
Logging is the process of tracking and storing events that occur in the system. Logs contain messages about errors and debug or stack traces for a specific part of code, a command, or an operation. You can get the root cause of latency or error from logs.
Tracing
Tracing is obtaining user event and performance data in a distributed system. Traces describe the end-to-end state of a system’s health as users interact with multiple parts of the system — or all of it. This view is broader and more continuous than logs.
With observability in place, we know when a part of the system breaks and can preempt future problems. We also gain insights that aid business analytics and help identify opportunities to improve the system’s performance or reliability.
As Kubernetes usage advances and the community expands, several tools have entered the market to help monitor Kubernetes clusters, designed to improve Kubernetes management and operations. Two popular tools in the Kubernetes ecosystem are Prometheus and Grafana, and they both empower software engineers to carry out observability on Kubernetes clusters.
Prometheus enables you to monitor your Kubernetes infrastructure metrics and cluster health while providing a visual UI and alert framework. Grafana is a web application that allows you to create graphs and charts of your Kubernetes data and metrics. It also provides a dashboard where you can display your vital metrics and features an alert system for notifications.
This tutorial shows you how to set up Prometheus and Grafana for your Kubernetes clusters. You will also learn how to configure Grafana to receive data from Prometheus for building visualization dashboards.
Prerequisites
This tutorial assumes you have:
- A basic understanding of Kubernetes and cluster components
- Familiarity with the kubectl command and the ability to use it to manage your cluster
A running Kubernetes cluster. If you don’t have one yet, you can create one with minikube by following the official Kubernetes documentation guide.
Creating a Kubernetes Observability Dashboard with Prometheus and Grafana
First, we’ll install Prometheus with a Helm chart. Helm is a templating engine used to create Kubernetes manifests for installing and upgrading applications running on Kubernetes. This reduces the effort involved in deploying and managing an application on Kubernetes. You can learn more about Helm from its documentation.
On Linux, update your dependencies and install Helm:
sudo apt-get update
sudo apt-get install helm
On macOS:
brew install helmCheck out the official Helm installation guide for other platforms and methods of installing Helm.
After installing Helm, we can then use an open source Helm chart for Prometheus to install Prometheus. Bitnami provides the Helm chart, consisting of different Prometheus configuration options.
Use the following Bash command to add the Bitnami Helm repository:
helm repo add bitnami https://charts.bitnami.com/bitnamiYour terminal should display a response like this:
"bitnami" has been added to your repositoriesNext, update the pulled repo with the following command in the terminal:
helm repo updateYou get the following response:
Hang tight while we grab the latest from your chart repositories...
...Successfully got an update from the "bitnami" chart repository
Update Complete. ⎈Happy Helming!⎈
Now, you can use the helm install command to install Prometheus with the default configuration options as shown in the following command:
helm install prometheus bitnami/kube-prometheusYou’ll get a response like this:
...

NAME: prometheus
LAST DEPLOYED: Mon Jun 13 00:27:16 2022
NAMESPACE: default
STATUS: deployed
REVISION: 1
TEST SUITE: None
NOTES:
CHART NAME: kube-prometheus
CHART VERSION: 8.0.6
APP VERSION: 0.57.0

...
Run the following kubectl command to view the newly created pods:
kubectl get podsYou’ll then see the new pods like this:
alertmanager-prometheus-kube-prometheus-alertmanager-0          2/2     Running   0              2m
prometheus-kube-prometheus-blackbox-exporter-7dc9d66884-7qx9z   1/1     Running   0              3m
prometheus-kube-prometheus-operator-5c794cb844-crltq            1/1     Running   0              3m
prometheus-kube-state-metrics-58d8796d68-hfz9s                  1/1     Running   0              3m
prometheus-node-exporter-mkdvs                                  1/1     Running   0              3m
prometheus-prometheus-kube-prometheus-prometheus-0              2/2     Running   0              2m
Now, we’ll use the following terminal command to expose Prometheus on port 9090:
kubectl port-forward --namespace default svc/prometheus-kube-prometheus-prometheus 9090:9090With the kubectl port-forward command above, we have linked the prometheus-server pod to port 9090 on our localhost. Therefore, web requests to port 9090 go to the pod.
You should get a response like this:
Forwarding from 127.0.0.1:9090 -> 9090
Forwarding from [::1]:9090 -> 9090
If you navigate to https://localhost:9090/ on your web browser, you see the Prometheus dashboard:
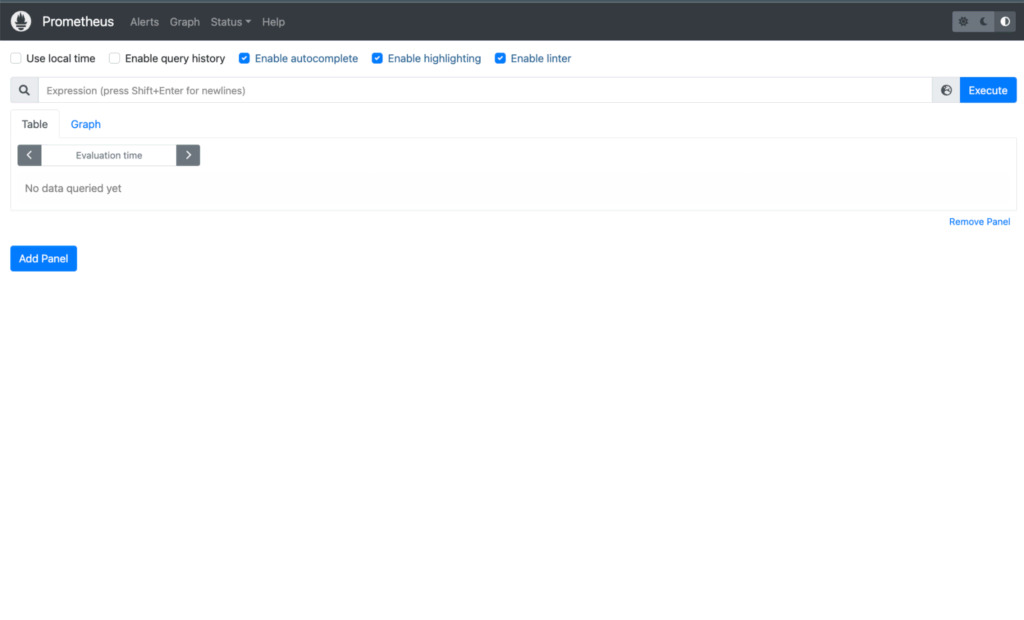
If you got the above result in your web browser, you have successfully installed and configured Prometheus. Congratulations! You may view the metrics that Prometheus collects about itself at https://localhost:9090/metrics.
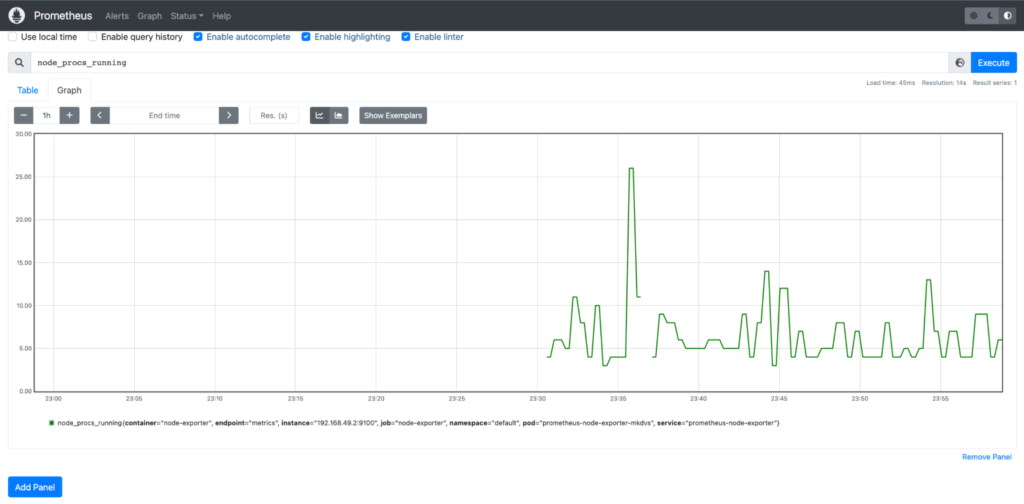
On the Prometheus web interface, you can use the Expression search bar to input some metrics you want to view. For instance, the following screenshot is for the node_procs_running expression for a graph of the running node processes when the user switches to the Graph tab.
Adding Grafana
We use another Helm chart provided by Bitnami for the Grafana installation. It also allows several configuration options, but we use the default configuration for this tutorial. Simply use the following Helm command on your terminal to install Grafana.
helm install grafana bitnami/grafanaYou should get a terminal response like this:
NAME: grafana
LAST DEPLOYED: Mon Jun 13 01:05:58 2022
NAMESPACE: default
STATUS: deployed
REVISION: 1
TEST SUITE: None
NOTES:
CHART NAME: grafana
CHART VERSION: 7.9.7
APP VERSION: 8.5.5

...
Use the following command on the command line to check for the newly created pod:
kubectl get podsYou should see an entry that looks like this:
grafana-76fc5f9445-r8lzc 1/1 Running 0 2m59sThen, use the following command to get the Grafana password:
echo "$(kubectl get secret grafana-admin --namespace default -o jsonpath="{.data.GF_SECURITY_ADMIN_PASSWORD}" | base64 --decode)"Note the password shown in the terminal response. The default username is admin. You will need the username and password to access the Grafana web UI.
To expose Grafana, you can use the kubectl port-forward command to connect port 3000 after creating a variable called POD_NAME for the pod:
export POD_NAME=$(kubectl get pods --namespace default -l "app.kubernetes.io/name=grafana,app.kubernetes.io/instance=grafana" -o jsonpath="{.items[0].metadata.name}")
kubectl --namespace default port-forward $POD_NAME 3000
You should get a terminal response like this:
Forwarding from 127.0.0.1:3000 -> 3000
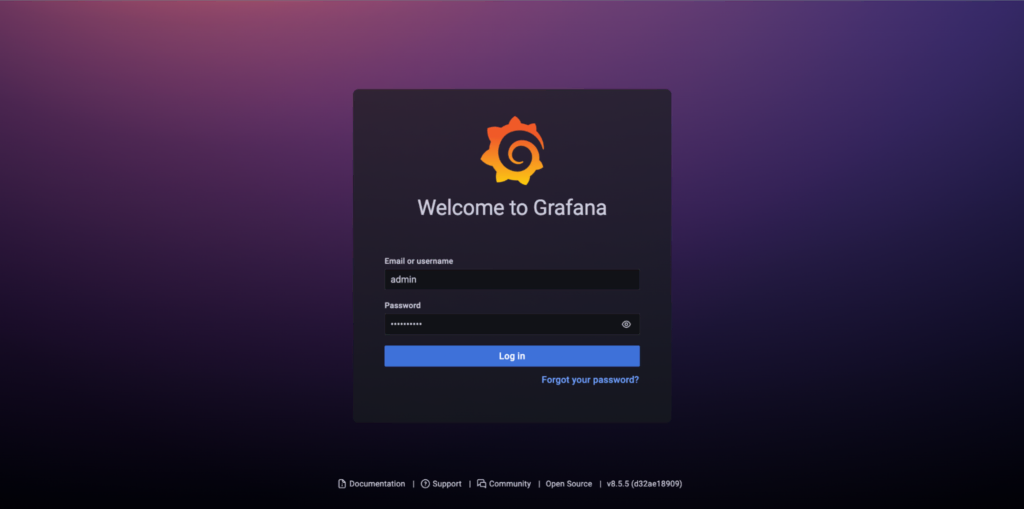
Forwarding from [::1]:3000 -> 3000Then, navigate to https://localhost:3000/ to log in with the credentials you noted above.
How to choose metrics to monitor on the Grafana dashboard
If you’re able to log in successfully to Grafana, you can then configure Grafana to work with Prometheus to create a dashboard that offers observability into your Kubernetes cluster. Follow the steps below to set up Prometheus as your data source in Grafana.
Navigate to the Configuration menu on the left-side menu bar. Select Data Sources on the menu list to go to the Data Sources page.
On the Data Sources page, click Add Data Source.
Select the Prometheus option in the Time series databases section.
Supply the HTTP URL, which is the service name you connected Prometheus to while exposing it: https://prometheus-kube-prometheus-prometheus.default.svc.cluster.local:9090
Leave the Auth, Alerting, and Misc settings as default for this tutorial.
Scroll down and click Save & test.
You can design your dashboard if you already have some familiarity with Grafana dashboards. Otherwise, you can avail yourself of a wide variety of pre-built dashboards from the Grafana library. For this tutorial, we use a Kubernetes dashboard with the ID 10000 titled Cluster Monitoring for Kubernetes.
Hover over the Dashboards menu on the main menu bar.
Click Browse to go to the Dashboards page.
Then, click Import in the top-right corner.
Supply the dashboard URL and click Load.
After loading the dashboard, select your data source in the list of data sources, and click Import.
In your newly built dashboard, you can view how much memory, CPU, and filesystem your Kubernetes cluster has used from the available amount. This is shown in the dashboard screenshot below.
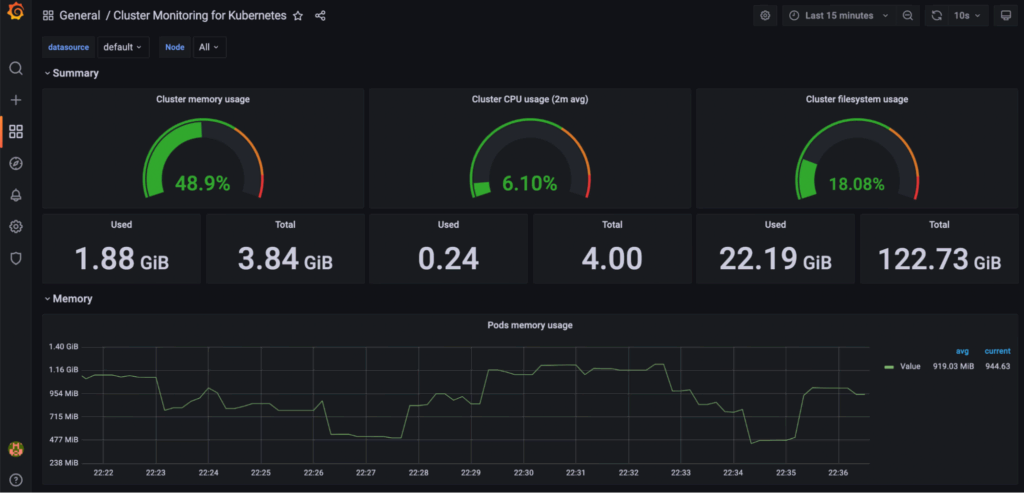
You can also see the consumption of memory by the pods over time, as shown below.
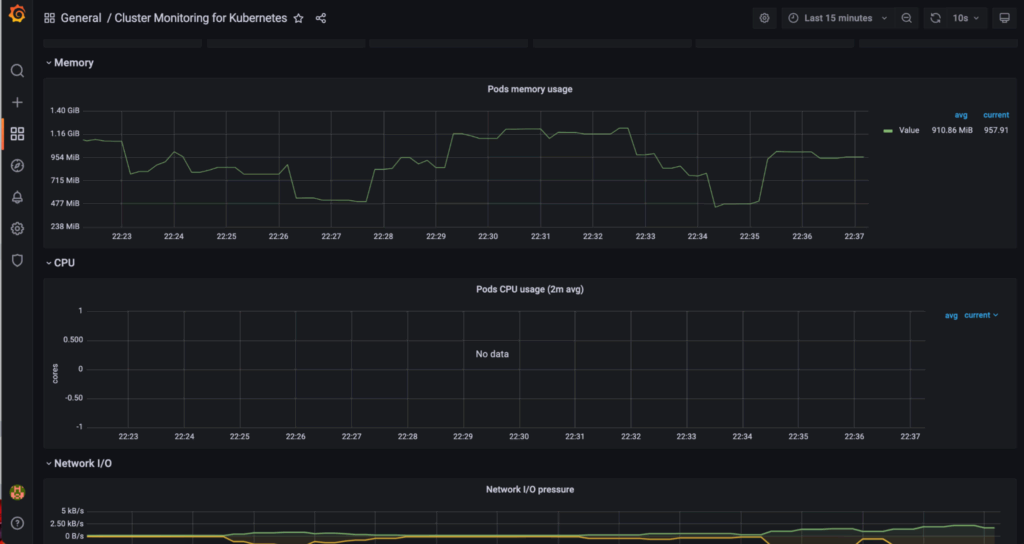
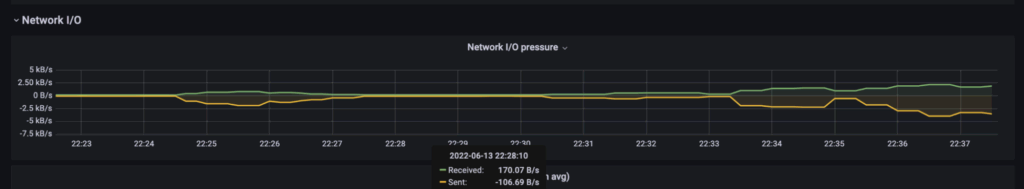
In addition, you can view the Network I/O pressure of your cluster, as shown below.
Conclusion
In this article, we have explored the essence of observability in Kubernetes management. It helps to foresee technical problems and serves as a means of providing business insights from the Kubernetes operations infrastructure. After that, we went over creating an observability dashboard with Prometheus and Grafana.
This tutorial provided a hands-on approach to getting started with your Kubernetes observability using two popular observability tools. With this knowledge, you can set up observability tools for your Kubernetes workloads.
To learn more about how we use Prometheus and Grafana at Mattermost, here are some additional articles you might want to check out:
- Monitoring the Mattermost server with Prometheus and Grafana
- Streamlining developer access to Prometheus and Grafana
This blog post was created as part of the Mattermost Community Writing Program and is published under the CC BY-NC-SA 4.0 license. To learn more about the Mattermost Community Writing Program, check this out.