
Monitoring with Prometheus on AWS EC2
Applications and servers need to be constantly monitored to prevent failure and also be able to detect issues on time. This blog post outlines how developers can use Prometheus to monitor applications on AWS EC2 instances.
Prometheus
Prometheus was designed for monitoring distributed systems. It’s an open source technology designed to provide monitoring and alerting functionality for cloud-native environments. The solution collects and stores its metrics as time-series data.
Prometheus has a central component called the Prometheus server that collects the metrics from different nodes. Prometheus server uses the concept of scraping by contacting the target system’s metric endpoints to fetch data at regular intervals.
How Prometheus works
- Prometheus collects data in the form of time series. The time series are built through a pull model.
- The Prometheus server queries (scrapes) a list of data sources (sometimes called exporters) at a specific polling frequency.
- Prometheus data is stored in the form of metrics, with each metric having a name that is used for referencing and querying it.
- Prometheus stores data locally on disk, which helps for fast data storage and fast querying the ability to store metrics in remote storage.
- Each Prometheus server is standalone, not depending on network storage or other remote services.
Prerequisites
This guide will be a step-by-step tutorial. To follow along, be sure to have an AWS account. To create a new account, click this link.
Create a Linux EC2 instance
The first step in this tutorial is to create two Linux instances. The first instance machine you’ll be creating is for Prometheus.
Log into the AWS console to launch an instance. Select the free tier-eligible Amazon Linux 2 instance.

Next, choose t2.micro as the instance type.

Select the default VPC and subnet and leave other settings at default. You can choose to add settings to your instance based on a personal decision, but for this tutorial, we’ll leave these settings at default.
For the security group, set the name as Prometheus-sg. We’ll open port 22 to be able to SSH into our Linux machine, we’ll open port 9090 for Prometheus, port 9100 for Node-exporter, and port 9093 for Alertmanager.

For this tutorial, we only need 8GB of storage.

Be sure to add a key pair so you can log in via SSH:

Back at the top, add a name tag. The name tag for this instance will be prometheus-server.
After reviewing the settings one more time, confirm all instance settings are correct. Then click launch.
Excellent! Our Linux server instance is up and running.

Create a second Linux EC2 instance
The first instance machine you created was for Prometheus. The second instance machine will be for Node-exporter. You can follow the same instruction above to create the second Linux instance machine, naming it prometheus-server.

Install Node-exporter
Now you have your infrastructure ready, we can continue the process. Use SSH to access linux-server to install node-exporter. The key pair generated for this machine is Linux-machine. Depending on where your key is and how your local machine is configured, your SSH command could look similar to this:
Ssh -i "C:\Users\TETTEH ISRAEL\Downloads\linux-machine.pem" ec2-user@ <YOUR.LINUX-SERVER.IP.ADDRESS>
Now, we have successfully logged in to our Linux-server instance. We’ll visit prometheus.io to download node-exporter.
$ cd /opt/
$ sudo wget https://github.com/prometheus/node_exporter/releases/download/v1.4.0-rc.0/node_exporter-1.4.0-rc.0.linux-amd64.tar.gz
Run the following command to extract the downloaded file:
$ sudo tar xf node_exporter-1.4.0-rc.0.linux-amd64.tar.gzRun the following command to change sudo mv node_exporter-1.4.0-rc.0.linux-amd64 to node_exporter for easy access.
$ sudo mv node_exporter-1.4.0-rc.0.linux-amd64 node_exporterRun the following command to cd into node_exporter:
$ cd node_exporterRun the following command to call the node_exporter script:
$ sudo ./node_exporter
You can access the node_exporter agent at Linux-serverIP:9100

Congratulations! You’re done with installing a node-exporter on your Linux-server.
Install Prometheus
We have successfully installed Node-exporter on our Linux-server instance. The next step is to install Prometheus on our Prometheus-server.
We’ll SSH into our Prometheus-server similarly:
ssh -i "C:\Users\TETTEH ISRAEL\Downloads\prometheus-server.pem" ec2-user@<YOUR.PROMETHEUS-SERVER.IP.ADDRESS>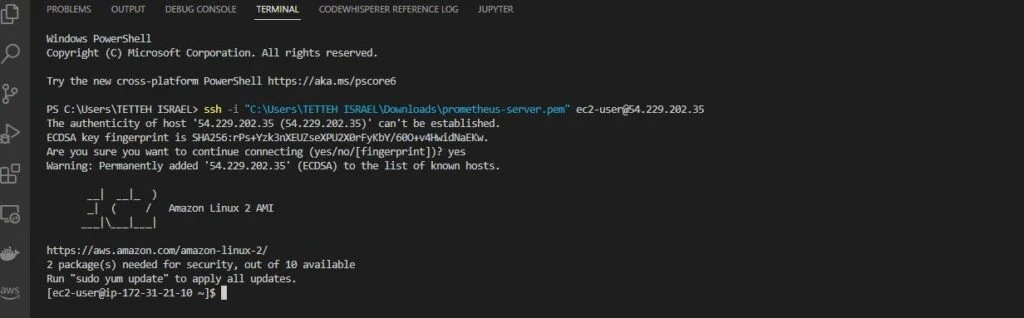
Now, we have successfully logged in to our Prometheus-server instance. We’ll visit prometheus.io to install the Prometheus agent on our instance. Now run the following command to download Prometheus on our instance:
$ sudo wget https://github.com/prometheus/prometheus/releases/download/v2.37.0/prometheus-2.37.0.linux-amd64.tar.gz
Let’s extract the downloaded file by running the following command:
$ sudo tar xf prometheus-2.37.0.linux-amd64.tar.gzNext, we will rename prometheus-2.37.0.linux-amd64 to prometheus for easy access:
$ sudo mv prometheus-2.37.0.linux-amd64/ prometheusRun the following command to change the directory to Prometheus:
$ cd prometheusLet’s edit our prometheus.yml file. Running the following command will open prometheus.yml in Vim:
$ sudo vi prometheus.ymlYou could also use Nano instead, if you prefer:
$ sudo nano prometheus.ymlReplace <YOUR.LINUX-SERVER.IP.ADDRESS> in my example below with your own linux-server’s private IP address:
# my global config
global:
  scrape_interval: 15s # Set the scrape interval to every 15 seconds. Default is every 1 minute.
  evaluation_interval: 15s # Evaluate rules every 15 seconds. The default is every 1 minute.
  # scrape_timeout is set to the global default (10s).

# Alertmanager configuration
alerting:
  alert managers:
    - static_configs:
        - targets:
          # - alertmanager:9093

# Load rules once and periodically evaluate them according to the global 'evaluation_interval'.
rule_files:
  # - "first_rules.yml"
  # - "second_rules.yml"

# A scrape configuration containing exactly one endpoint to scrape:
# Here it's Prometheus itself.
scrape_configs:
  # The job name is added as a label `job=<job_name>` to any timeseries scraped from this config.
  - job_name: "prometheus
    # metrics_path defaults to '/metrics'
    # scheme defaults to 'http'.

    static_configs:
      - targets: ["localhost:9090",<YOUR.LINUX-SERVER.IP.ADDRESS>:9100]
Call the Prometheus script
Run the following command to call the Prometheus script:
$ sudo ./prometheus
Currently, Prometheus is running on port 9090. If you check yourip:9090, you will see your Prometheus dashboard. Click on the status drop-down and select targets.

Congratulations, you’re now monitoring EC2 instances using Prometheus!
Continue learning about monitoring
Node-exporter measures multiple metrics such as memory, disk space, CPU, and network traffic. By monitoring these metrics with a tool like Prometheus, you can manage distributed systems over a network, no matter how complex or large.
Now that you have a better understanding of how to monitor EC2 instances with Prometheus, continue your learning by learning how to build a custom Grafana dashboard for Kubernetes observability.
This blog post was created as part of the Mattermost Community Writing Program and is published under the CC BY-NC-SA 4.0 license. To learn more about the Mattermost Community Writing Program, check this out.